
|
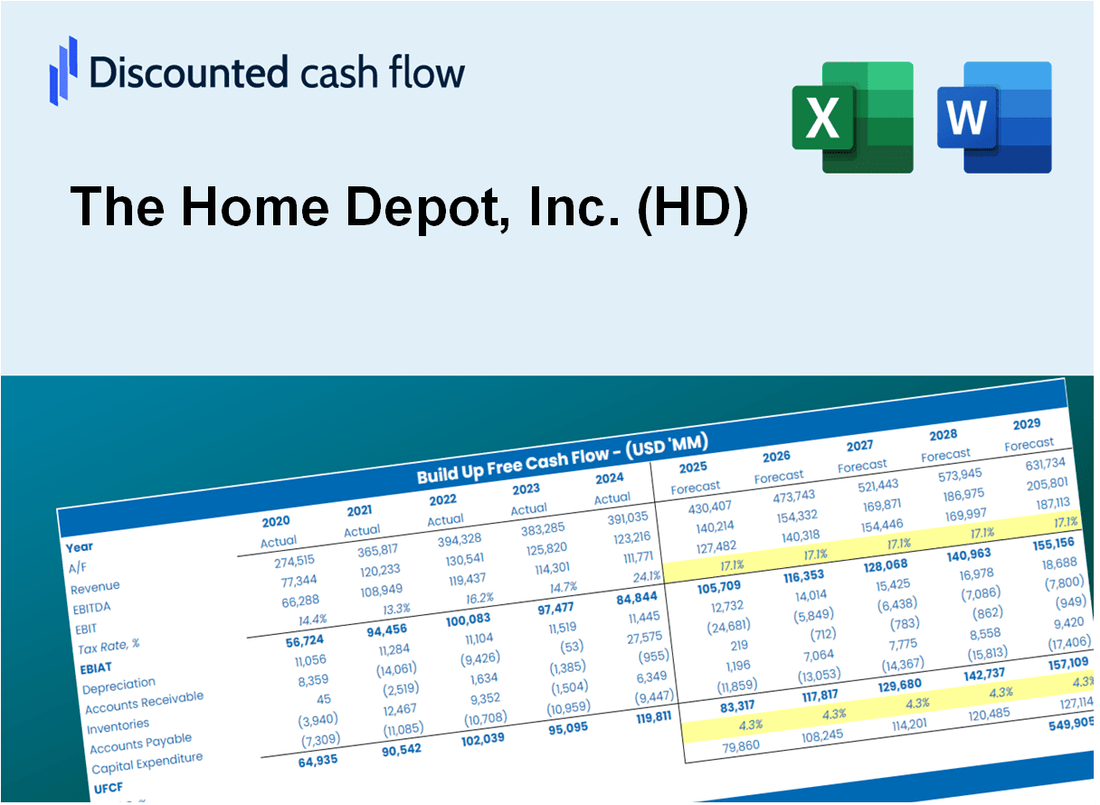
La valoración DCF de The Home Depot, Inc. (HD) |
Completamente Editable: Adáptelo A Sus Necesidades En Excel O Sheets
Diseño Profesional: Plantillas Confiables Y Estándares De La Industria
Predeterminadas Para Un Uso Rápido Y Eficiente
Compatible con MAC / PC, completamente desbloqueado
No Se Necesita Experiencia; Fáciles De Seguir
The Home Depot, Inc. (HD) Bundle
Ya sea que sea un inversor o analista, esta calculadora DCF (HD) es su recurso de referencia para una valoración precisa. Estoblado de datos reales de Home Depot, Inc., puede ajustar los pronósticos y observar los efectos en tiempo real.
What You Will Get
- Real HD Financials: Access to historical and projected data for precise valuation.
- Customizable Inputs: Adjust WACC, tax rates, revenue growth, and capital investments.
- Dynamic Calculations: Intrinsic value and NPV are computed automatically.
- Scenario Analysis: Evaluate various scenarios to assess The Home Depot’s future performance.
- User-Friendly Design: Designed for professionals but easy for newcomers to navigate.
Key Features
- Real-Life HD Data: Pre-filled with Home Depot’s historical financials and future projections.
- Fully Customizable Inputs: Modify revenue growth, profit margins, WACC, tax rates, and capital expenditures.
- Dynamic Valuation Model: Automatic recalculations of Net Present Value (NPV) and intrinsic value based on your adjustments.
- Scenario Testing: Develop various forecast scenarios to evaluate different valuation results.
- User-Friendly Design: Intuitive, organized, and tailored for both professionals and novices.
How It Works
- Download the Template: Gain immediate access to the Excel-based HD DCF Calculator.
- Input Your Assumptions: Modify the yellow-highlighted cells for growth rates, WACC, profit margins, and more.
- Instant Calculations: The model automatically calculates The Home Depot’s intrinsic value.
- Test Scenarios: Experiment with various assumptions to assess potential changes in valuation.
- Analyze and Decide: Utilize the results to inform your investment or financial analysis.
Why Choose The Home Depot, Inc. (HD)?
- Extensive Product Range: A vast selection of home improvement products to meet all your needs.
- Expert Advice: Knowledgeable staff ready to assist you with project planning and product selection.
- Competitive Pricing: Affordable options that fit any budget without compromising quality.
- Convenient Shopping Experience: Multiple shopping options including online, in-store, and curbside pickup.
- Community Commitment: Actively supports local communities through various initiatives and programs.
Who Should Use This Product?
- Homeowners: Make informed decisions on home improvement projects with expert guidance.
- Contractors: Streamline your workflow with a comprehensive inventory of tools and materials.
- Interior Designers: Easily find and source products for client projects or renovations.
- DIY Enthusiasts: Enhance your skills and creativity with a wide range of tutorials and resources.
- Educators and Students: Utilize it as a practical resource for learning about home improvement and construction.
What the Template Contains
- Comprehensive DCF Model: Editable template with detailed valuation calculations tailored for The Home Depot, Inc. (HD).
- Real-World Data: The Home Depot's historical and projected financials preloaded for analysis.
- Customizable Parameters: Adjust WACC, growth rates, and tax assumptions to explore different scenarios.
- Financial Statements: Full annual and quarterly breakdowns for enhanced insights into The Home Depot, Inc. (HD).
- Key Ratios: Built-in analysis for profitability, efficiency, and leverage specific to The Home Depot, Inc. (HD).
- Dashboard with Visual Outputs: Charts and tables for clear, actionable results related to The Home Depot, Inc. (HD).
Disclaimer
All information, articles, and product details provided on this website are for general informational and educational purposes only. We do not claim any ownership over, nor do we intend to infringe upon, any trademarks, copyrights, logos, brand names, or other intellectual property mentioned or depicted on this site. Such intellectual property remains the property of its respective owners, and any references here are made solely for identification or informational purposes, without implying any affiliation, endorsement, or partnership.
We make no representations or warranties, express or implied, regarding the accuracy, completeness, or suitability of any content or products presented. Nothing on this website should be construed as legal, tax, investment, financial, medical, or other professional advice. In addition, no part of this site—including articles or product references—constitutes a solicitation, recommendation, endorsement, advertisement, or offer to buy or sell any securities, franchises, or other financial instruments, particularly in jurisdictions where such activity would be unlawful.
All content is of a general nature and may not address the specific circumstances of any individual or entity. It is not a substitute for professional advice or services. Any actions you take based on the information provided here are strictly at your own risk. You accept full responsibility for any decisions or outcomes arising from your use of this website and agree to release us from any liability in connection with your use of, or reliance upon, the content or products found herein.