
|
The Howard Hughes Corporation (HHC): 5 FORCES Analysis [Apr-2026 Updated] |
Completamente Editable: Adáptelo A Sus Necesidades En Excel O Sheets
Diseño Profesional: Plantillas Confiables Y Estándares De La Industria
Predeterminadas Para Un Uso Rápido Y Eficiente
Compatible con MAC / PC, completamente desbloqueado
No Se Necesita Experiencia; Fáciles De Seguir
The Howard Hughes Corporation (HHC) Bundle
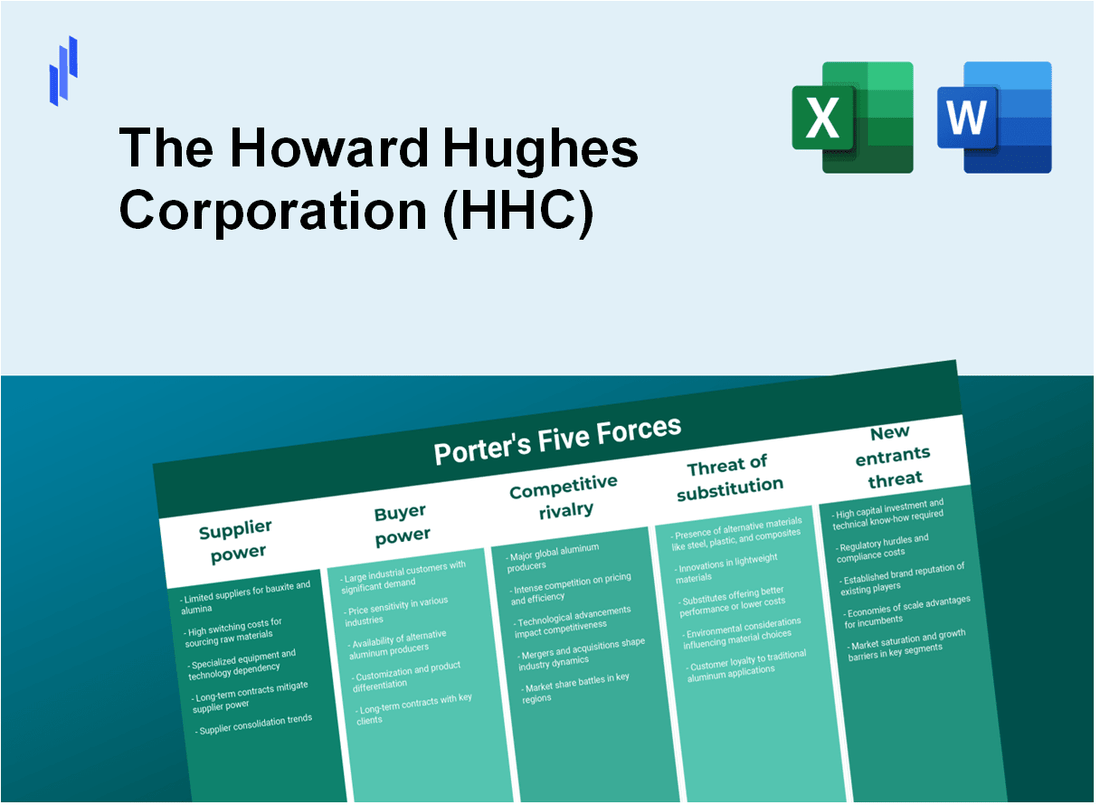
Explore how Michael Porter's Five Forces shape the strategic fortress of The Howard Hughes Corporation - from weakened supplier leverage and powerful luxury buyers to minimal regional rivalry, manageable substitutes, and nearly impenetrable entry barriers - revealing why HHC's capital strength, land control, and diversification into insurance make it a uniquely resilient player in master‑planned development and urban luxury markets; read on to see the forces that underpin its competitive moat.
The Howard Hughes Corporation (HHC) - Porter's Five Forces: Bargaining power of suppliers
STABILIZING CONSTRUCTION COSTS LIMIT SUPPLIER LEVERAGE: The bargaining power of construction material and labor suppliers has diminished as national construction cost escalation rates cooled to 1.12% in Q2 2024 and are projected at 1.3% for 2025. Although total construction spending remains ~40% above February 2020 levels, year‑over‑year growth slowed to 5.41% from prior peaks above 5.85%, reducing the urgency for suppliers to push for higher pricing. Howard Hughes (HHC) preserves negotiating leverage via substantial liquidity and structured financing: $1.3 billion in undrawn lender commitments available for property development as of late 2025, and use of non‑recourse project‑level financing (example: a 7.073% fixed‑rate loan used to retire maturing construction debt). These financial positions enable HHC to negotiate favorable terms with general contractors and architecture firms (e.g., Robert A.M. Stern Architects), shift risk to project‑level lenders, and lock in prices.
| Metric | Value |
|---|---|
| National construction cost escalation (Q2 2024) | 1.12% |
| Projected construction cost escalation (2025) | 1.3% |
| Total construction spending vs Feb 2020 | ~40% higher |
| Y/Y construction spending growth (most recent) | 5.41% |
| Undrawn lender commitments (late 2025) | $1.3 billion |
| Representative project loan used to retire debt | 7.073% fixed‑rate non‑recourse |
Key tactical measures HHC employs to stabilize supplier dynamics include:
- Maintaining large undrawn credit facilities ($1.3B) to avoid price‑sensitive supplier concessions.
- Using non‑recourse, project‑level fixed‑rate loans to isolate projects and cap construction finance costs (example: 7.073% loan).
- Negotiating fixed-price or GMP (guaranteed maximum price) contracts with general contractors to transfer cost escalation risk.
- Leveraging long‑term relationships with select architectural and engineering firms (e.g., Robert A.M. Stern Architects) to ensure predictable scope and pricing.
CAPITAL PROVIDERS FACE REDUCED BARGAINING POWER THROUGH FIXED DEBT: Financial suppliers' leverage over HHC is limited because 92% of the company's $5.22 billion total debt is fixed or swapped to fixed rates. Approximately 80% of debt maturities are not due until 2027 or later, insulating HHC from near‑term credit market stress and rate variability. Strategic refinancing reduced 2025 debt maturities by $150 million, leaving only $76 million in near‑term maturities. A substantial cash reserve ($1.5 billion as of Q3 2025) and a 3.8x interest coverage ratio further diminish the need to accept onerous lender terms, enabling HHC to self‑fund or negotiate favorable covenant and pricing structures.
| Debt Metric | Value |
|---|---|
| Total debt | $5.22 billion |
| Share fixed or swapped to fixed | 92% |
| % debt maturities due 2027 or later | ~80% |
| Reduction in 2025 debt obligations (refinancings) | $150 million |
| Near‑term maturities remaining (post‑refinance) | $76 million |
| Cash reserve (Q3 2025) | $1.5 billion |
| Interest coverage ratio | 3.8x |
MUNICIPAL UTILITY DISTRICTS ACT AS ESSENTIAL INFRASTRUCTURE PARTNERS: The bargaining power of local infrastructure suppliers, particularly Municipal Utility Districts (MUDs), is moderated by HHC's ability to monetize MUD receivables and control development pace. Recent MUD receivable transactions generated $180 million in proceeds-among the largest such sales executed by the company-and proceeds have been used to pay down credit lines in Bridgeland and other Texas communities. By delivering 349 residential acres in a single quarter and achieving a record average land sale price of $1.35 million per acre in mid‑2025, HHC dictates the timing and scale of infrastructure rollouts, preserving economic upside while allowing MUDs to recover costs through structured repayments.
| MUD / Infrastructure Metric | Value |
|---|---|
| MUD receivables proceeds (recent) | $180 million |
| Residential acres delivered in one quarter | 349 acres |
| Record average land sale price (mid‑2025) | $1.35 million / acre |
| Use of MUD proceeds | Pay down credit lines in Bridgeland and other TX communities |
Net effect: Supplier groups-construction materials/labor, capital providers, and municipal infrastructure partners-retain necessary roles but face constrained leverage due to moderated cost inflation, HHC's high proportion of fixed debt and strong liquidity ($1.3B undrawn + $1.5B cash), active balance‑sheet management (refinancings reducing near‑term maturities by $150M), and the company's control over development pacing and MUD monetization ($180M proceeds). These structural and financial strengths allow HHC to absorb infrastructure costs and negotiate contractual terms that limit supplier capture of development economics.
The Howard Hughes Corporation (HHC) - Porter's Five Forces: Bargaining power of customers
National homebuilders exhibit moderate bargaining power through bulk purchases of land, but HHC's scale, rare asset positions and demonstrated pricing outcomes constrain that power. Large-scale builders such as Lennar and Pulte acquired a 231‑acre superpad in Summerlin in late 2025 at $434,000 per acre; despite the volume, the transaction yielded a 75% profit margin for HHC, underscoring the company's ability to extract value even on bulk deals.
While new home sales across HHC communities declined 13% year‑over‑year, demand for residential land remains supported by a chronic undersupply of existing homes, preserving HHC's negotiating leverage with builders. In Q3 2025 HHC sold 349 residential acres and generated a record $205 million in Master Planned Community (MPC) earnings before taxes, enabling management to raise full‑year 2025 EBT guidance to $450 million - an indicator of meaningful pricing power versus builder customers.
| Metric | Value | Context / Implication |
|---|---|---|
| Superpad sale (Summerlin) | 231 acres at $434,000/acre | High‑volume sale that still delivered 75% profit margin to HHC |
| Q3 2025 residential acres sold | 349 acres | Record MPC EBT contribution |
| Q3 2025 MPC EBT | $205 million | Supports ability to negotiate pricing with builders |
| Full‑year 2025 EBT guidance | $450 million | Raised guidance reflecting pricing power and demand |
| New home sales change | -13% YoY | Softness in sales but land demand resilient |
High‑net‑worth luxury condo buyers at Ward Village display limited bargaining power because of scarce premium inventory and exceptionally strong demand. HHC has contracted $1.4 billion in future condo sales tied to the Melia and Ilima tower launches; as of September 2025 those two towers were 57% pre‑sold and one penthouse closed at a record $40 million.
Across the six newest towers in Hawaii, HHC has sold or pre‑sold 2,070 residences, including 100% of Ulana Ward Village. The Victoria Place tower's recent delivery produced $211.1 million in adjusted gross profit, demonstrating both high margins and constrained buyer leverage in the ultra‑luxury segment.
| Luxury condo metric | Figure | Note |
|---|---|---|
| Contracted future condo sales revenue | $1.4 billion | Melia and Ilima towers main drivers |
| Pre‑sale rate (Melia + Ilima) | 57% (as of Sep 2025) | Strong early absorption |
| Penthouse sale | $40 million | Record price - limited buyer leverage |
| Residences sold or pre‑sold (6 newest towers) | 2,070 units | Includes 100% of Ulana |
| Adjusted gross profit (Victoria Place) | $211.1 million | High margin realization on delivered product |
Commercial tenants (office and retail) retain measurable leverage amid a softening office market, forcing HHC to balance occupancy targets with concessioning and amenity investments. HHC's stabilized office portfolio was 89% leased in Q3 2025, while the multifamily portfolio reached 96% occupancy. Despite headwinds, office NOI increased 7% YoY and retail NOI increased 9% YoY, contributing to a quarterly NOI portfolio of approximately $68 million.
During the year HHC executed 129,000 square feet of new or expanded leases to offset expiring rent abatements. Management targets $353 million in stabilized NOI and must offer competitive amenities, leasing flexibility and tenant services to attract and retain high‑quality commercial tenants in a post‑pandemic environment.
| Commercial metric | Figure | Implication |
|---|---|---|
| Stabilized office leased rate | 89% | Some vacancy risk - tenant negotiating leverage |
| Multifamily occupancy | 96% | Strong residential demand within portfolio |
| Quarterly NOI portfolio | $68 million | Core income generation requiring tenant retention |
| Office NOI YoY change | +7% | Resilient performance despite broader office softness |
| Retail NOI YoY change | +9% | Retail demand supporting leasing outcomes |
| New/expanded leases executed | 129,000 sq ft | Offsetting rent abatements and expirations |
| Stabilized NOI target | $353 million | Operational benchmark driving tenant strategies |
- Key takeaway for homebuilder customers: moderate bargaining power constrained by scarce land supply and HHC's demonstrated pricing outcomes (e.g., 75% margin on large superpad sale).
- Key takeaway for luxury condo buyers: low bargaining power due to scarcity and strong pre‑sales; HHC captures high margins (e.g., $211.1M adjusted gross profit on Victoria Place).
- Key takeaway for commercial tenants: moderate leverage driven by office market softness; HHC must balance concessions and amenity investment to hit $353M stabilized NOI target.
The Howard Hughes Corporation (HHC) - Porter's Five Forces: Competitive rivalry
DOMINANT MARKET POSITION IN SUMMERLIN LIMITS REGIONAL RIVALRY
Howard Hughes' Summerlin master-planned community holds a dominant position in the Las Vegas region, with multi-decade operating history (≈35 years) and control of thousands of contiguous acres. Recent transactions illustrate limited regional rivalry: 318 acres sold in a single quarter, custom lot pricing up to $5.5 million per lot, and superpad sales achieving $1.7 million per acre for non-bulk transactions in late 2025. These pricing and volume metrics enabled a 42% year-over-year increase in Master Planned Community EBT in Q3 (year not specified by source), reflecting pricing power and scarce comparable luxury inventory within the market.
The scale advantage-land bank, entitlement timing, and integrated infrastructure-creates high barriers to entry for competitors seeking to replicate Summerlin's live-work-play model, while enabling premium capture across lot, home, retail, and amenities revenue streams.
| Metric | Summerlin (Las Vegas) | Ward Village (Honolulu) | Company Consolidated |
|---|---|---|---|
| Operating history (years) | ≈35 | - (ongoing phased development) | Multiple MPUs across regions |
| Recent acreage sold (single quarter) | 318 acres | - | 318+ (regional parcel sales) |
| Custom lot max price | $5.5M | - | Up to $5.5M (regional high) |
| Superpad price (non-bulk) | $1.7M/acre (late 2025) | - | $1.7M/acre peak regionally |
| Master Planned Community EBT YoY (Q3) | +42% | - | +42% in MPC segment |
STRATEGIC TRANSFORMATION INTO A DIVERSIFIED HOLDING COMPANY
The competitive landscape is shifting as HHC pivots from a pure-play developer to a diversified holding company after a $900 million strategic investment from Pershing Square. Key transactions and metrics include:
- $2.1 billion acquisition of the Vantage Group (December 2025) to enter insurance and asset management lines.
- Operating margin: 28.41% (company-reported).
- Net margin: 14.95% (company-reported).
- Target: build an investment-grade diversified platform leveraging external capital and Pershing Square advisory influence (Bill Ackman linkage).
This transformation reduces direct rivalry with cyclical, single-market real estate developers by creating revenue mix resilience (real estate development + insurance/investment operations + recurring fee income). HHC's superior margins suggest outperformance versus many regional developers whose operating leverage and margins are more susceptible to downturns.
| Financial Metric | HHC | Median Regional Developer (approx.) |
|---|---|---|
| Operating margin | 28.41% | ~10-18% |
| Net margin | 14.95% | ~3-8% |
| Strategic investment (Pershing Square) | $900M | Typically none / minority capital |
| Acquisition spend (Vantage Group) | $2.1B (Dec 2025) | Rare for regional peers |
HAWAIIAN CONDO MARKET LEADERSHIP CREATES A VIRTUAL MONOPOLY
Ward Village (Honolulu) operates as a roughly 60-acre master-planned urban enclave with scale and vertical integration that functionally limit competition in the luxury condominium sector. Concrete metrics:
- $1.4 billion in pre-sales for newest towers (highest-ever Hawaii volume and pricing for new construction).
- 2,070 residences sold or under development within the managed Ward Village community.
- The Launiu (11th residential tower) 68% pre-sold shortly after groundbreaking.
These data indicate the company captures a disproportionate share of luxury demand in Honolulu, with pre-sale velocity and price levels that smaller, single-tower or disconnected projects cannot match. The contiguous master-planned structure enables cross-selling, centralized marketing, and pricing discipline that together create a virtual monopoly over integrated luxury urban product in the market.
| Ward Village Metric | Value |
|---|---|
| Master-planned acreage | ~60 acres |
| Pre-sales (new towers) | $1.4B |
| Residences sold / under development | 2,070 |
| Launiu pre-sale level at recent break ground | 68% |
IMPLICATIONS FOR COMPETITIVE RIVALRY
HHC's rivalry profile varies by geography and business model: near-monopolistic dynamics in Summerlin and Ward Village due to scale, land control, and pre-sale dominance; reduced vulnerability to traditional real estate cyclicality through diversification into insurance and investment operations; and stronger margin and capital advantages aided by a $900M strategic investment and a $2.1B acquisition, positioning HHC to compete more with diversified conglomerates than with local single-market developers.
The Howard Hughes Corporation (HHC) - Porter's Five Forces: Threat of substitutes
LOW EXISTING HOME INVENTORY REDUCES RESIDENTIAL SUBSTITUTION
The primary substitute for new homes in Howard Hughes communities is the existing home market, which currently suffers from a severe lack of inventory. This scarcity has redirected buyer demand toward new construction, enabling HHC to sell 349 residential acres at an average price of $786,000 per acre in late 2025. Despite a 13% decline in new home sales volume year-over-year, constrained alternatives have sustained land demand among national homebuilders and preserved pricing power on lot sales.
Key indicators demonstrating limited substitution pressure from existing homes include high multifamily occupancy and record MPC (Master Planned Community) economics:
- 349 residential acres sold at $786,000/acre (late 2025)
- MPC EBT reached $205 million in Q3 2025
- Multifamily occupancy rate: 96%
- New home sales volume decline: -13% (YoY)
Below is a concise table summarizing residential substitution metrics and HHC outcomes for 2025:
| Metric | Value | Implication |
|---|---|---|
| Residential acres sold | 349 acres | Strong lot demand despite sales volume dip |
| Average price per acre | $786,000 | Maintained pricing power |
| MPC EBT (Q3 2025) | $205 million | Record profitability from community operations |
| Multifamily occupancy | 96% | Limited rental substitution capacity |
| New home sales volume change (YoY) | -13% | Demand softness, offset by low existing inventory |
Conclusion on residential substitutes: existing-home scarcity and high multifamily occupancy materially limit substitution threats to HHC's new-home and land businesses.
REMOTE WORK POSES A PERSISTENT THREAT TO OFFICE ASSETS
Remote and hybrid work models represent the most significant substitute for HHC's office portfolio. However, HHC has reduced substitution risk by developing amenity-rich, master-planned office environments that attract tenants seeking destination workplaces. The stabilized office portfolio was 89% leased in 2025, and office Net Operating Income (NOI) grew by 7% year-over-year. Total Operating Assets NOI for the quarter was $68 million, with The Woodlands and Summerlin leading performance.
Operational and leasing datapoints that quantify the current office substitution dynamic:
- Stabilized office occupancy: 89% leased
- Office NOI growth: +7% YoY (2025)
- Total Operating Assets NOI (quarter): $68 million
- New office leases signed: 129,000 sq ft (recent period)
Table summarizing office substitution metrics and responses:
| Metric | 2025 Value | Strategic Response |
|---|---|---|
| Stabilized office lease rate | 89% | High capture of tenant demand |
| Office NOI growth (YoY) | +7% | Resilient income despite remote work |
| Operating Assets NOI (quarter) | $68 million | Strong cash flow contribution |
| New leases signed | 129,000 sq ft | Evidence of sustained demand for physical offices |
| Anchor markets | The Woodlands; Summerlin | Primary drivers of office performance |
HHC's emphasis on amenity-rich, mixed-use campuses creates value that is less substitutable by remote work or suburban single-purpose offices, and commands rent premiums that mitigate the threat.
DIVERSIFICATION INTO INSURANCE HEDGES AGAINST REAL ESTATE SUBSTITUTES
By acquiring an insurance company for $2.1 billion in late 2025 and securing a $900 million capital infusion from Pershing Square at $100 per share, HHC has materially diversified revenue sources away from pure real estate. Projected adjusted operating cash flow for 2025 of $440 million will be augmented by insurance premiums and investment income, creating an internal cash-flow substitute that reduces reliance on cyclical land sales.
Key financial impacts and strategic benefits of the insurance acquisition:
- Insurance acquisition price: $2.1 billion (late 2025)
- Pershing Square capital infusion: $900 million at $100/share
- Projected 2025 adjusted operating cash flow: $440 million
- New cash-flow sources: insurance premiums + investment income
- Objective: reduce volatility from 'lumpy' land-sale revenue
Table presenting the diversification metrics and expected effect on substitution risk:
| Metric | Value / Transaction | Effect on Substitute Risk |
|---|---|---|
| Insurance acquisition cost | $2.1 billion | Creates recurring non-real-estate cash flow |
| Equity infusion | $900 million (Pershing Square) | Improves liquidity and balance-sheet flexibility |
| Projected adjusted operating cash flow (2025) | $440 million | Baseline operating liquidity before insurance income |
| New revenue streams | Premiums; investment returns | Reduces dependence on land-sale cycles |
| Strategic outcome | Holding company transformation | Multiple avenues for value creation beyond development |
The Howard Hughes Corporation (HHC) - Porter's Five Forces: Threat of new entrants
HIGH CAPITAL REQUIREMENTS AND LAND SCARCITY BAR ENTRY
The threat of new entrants is extremely low given the scale and capital intensity required to develop master-planned communities comparable to Summerlin (Las Vegas) or Bridgeland (Houston). As of December 2025 Howard Hughes holds $1.5 billion in cash and a market capitalization of $5.03 billion. The company controls large, contiguous land positions acquired over decades; replicating this requires securing thousands of acres of prime land in markets where developable acreage is increasingly scarce. HHC's debt balance of $5.22 billion is predominantly non‑recourse and project‑specific, reflecting a sophisticated financing structure that new developers rarely obtain. The 35‑year track record of Summerlin underscores the multi‑decade investment horizon and organizational expertise necessary to execute and monetize such master plans.
| Metric | Value (Dec 2025) | Relevance to New Entrants |
|---|---|---|
| Cash on hand | $1.5 billion | Provides liquidity buffer and acquisition capacity; deters cash‑constrained entrants |
| Market capitalization | $5.03 billion | Indicates public market scale and access to equity capital |
| Total debt | $5.22 billion (predominantly non‑recourse) | Reflects project‑level financing expertise difficult to match |
| Development history | 35 years (Summerlin) | Demonstrates institutional knowledge and long‑dated cash flow realization |
| Undeveloped acreage controlled | Thousands of acres across core markets | Land scarcity creates high entry cost and time to market |
REGULATORY AND ENTITLEMENT BARRIERS PROTECT EXISTING ASSETS
Regulatory entitlements and local approval processes act as durable barriers. In Hawaii, HCDA Mauka Area Rules govern redevelopment; HHC has secured entitlements for its 60‑acre Ward Village project, where contracted pre‑sales total $1.4 billion. In Texas, Municipal Utility District (MUD) structures and other public‑private arrangements require years to establish; HHC's MUD activity recently yielded $180 million in liquidity. The company's 2025 MPC (master planned community) EBT guidance of $450 million is effectively protected by these entitlement moats-new developers without pre‑existing approvals face lengthy delays, multi‑million dollar upfront infrastructure and entitlement costs, and uncertain political risk before any revenue is realized.
- Ward Village entitlements: 60 acres; $1.4 billion contracted pre‑sales
- MUD liquidity event (Texas): $180 million realized through established utility/district arrangements
- 2025 MPC EBT guidance: $450 million-dependent on in‑place entitlements and phased lot delivery
| Entitlement/Regulatory Item | HHC Position | Barrier Effect (to entrants) |
|---|---|---|
| Ward Village entitlements | Secured for 60 acres; $1.4B pre‑sales | Pre‑approved density and sales pipeline reduces time to revenue |
| HCDA compliance (Hawaii) | Portfolio compliant and tested | Complex local process deters outsiders |
| MUD arrangements (Texas) | Existing MUD structures generating liquidity | Years to form and finance for new entrants |
| Entitlement lead time | Multi‑year, multi‑million $ cost | Significant delay and upfront capital required |
PERSHING SQUARE BACKING STRENGTHENS THE COMPETITIVE MOAT
Strategic capital injections further raise the bar. Pershing Square's $900 million investment in 2025 provides HHC with a sizable war chest to pursue large acquisitions-evidenced by the $2.1 billion Vantage Group transaction-and to accelerate development where opportunistic land or pipeline exists. With approximately 92% of debt fixed and an interest coverage ratio of ~3.8x, HHC's financing profile is more resilient than that of a start‑up developer. Financial performance metrics such as 19% return on equity and a 28.41% operating margin create high performance benchmarks that new entrants would struggle to match. Additionally, a $1.3 billion undrawn credit facility enhances optionality to deploy capital quickly in response to competitive threats.
- Pershing Square capital injection: $900 million (2025)
- Recent acquisition: Vantage Group purchase for $2.1 billion
- Debt metrics: 92% fixed; ~3.8x interest coverage
- Key financials: 19% ROE; 28.41% operating margin
- Available liquidity: $1.3 billion undrawn credit facility
| Financial Strength Indicator | HHC Figure | Implication for New Entrants |
|---|---|---|
| Pershing Square investment | $900 million | Capital deterrent; ability to outbid/hold land |
| Acquisition capacity | Vantage Group: $2.1 billion transaction | Demonstrates ability to scale via M&A |
| Debt fixed rate exposure | ~92% fixed | Interest rate stability versus volatile new‑entrant financing |
| Interest coverage | ~3.8x | Comfort for creditors and ability to service debt through development cycles |
| Undrawn credit facility | $1.3 billion | Immediate liquidity to pursue opportunities or defend position |
Net effect: the combined weight of capital requirements, land scarcity, entitlement complexity, and enhanced financial backing results in an exceptionally low threat of new entrants for Howard Hughes' core master‑planned community and large mixed‑use development markets.
Disclaimer
All information, articles, and product details provided on this website are for general informational and educational purposes only. We do not claim any ownership over, nor do we intend to infringe upon, any trademarks, copyrights, logos, brand names, or other intellectual property mentioned or depicted on this site. Such intellectual property remains the property of its respective owners, and any references here are made solely for identification or informational purposes, without implying any affiliation, endorsement, or partnership.
We make no representations or warranties, express or implied, regarding the accuracy, completeness, or suitability of any content or products presented. Nothing on this website should be construed as legal, tax, investment, financial, medical, or other professional advice. In addition, no part of this site—including articles or product references—constitutes a solicitation, recommendation, endorsement, advertisement, or offer to buy or sell any securities, franchises, or other financial instruments, particularly in jurisdictions where such activity would be unlawful.
All content is of a general nature and may not address the specific circumstances of any individual or entity. It is not a substitute for professional advice or services. Any actions you take based on the information provided here are strictly at your own risk. You accept full responsibility for any decisions or outcomes arising from your use of this website and agree to release us from any liability in connection with your use of, or reliance upon, the content or products found herein.