
|
Valoración DCF de HIVE Blockchain Technologies Ltd. (HIVE) |
Completamente Editable: Adáptelo A Sus Necesidades En Excel O Sheets
Diseño Profesional: Plantillas Confiables Y Estándares De La Industria
Predeterminadas Para Un Uso Rápido Y Eficiente
Compatible con MAC / PC, completamente desbloqueado
No Se Necesita Experiencia; Fáciles De Seguir
HIVE Blockchain Technologies Ltd. (HIVE) Bundle
¿Busca determinar el valor intrínseco de Hive Blockchain Technologies Ltd.? Nuestra calculadora DCF Hive integra datos del mundo real con extensas características de personalización, lo que le permite refinar los pronósticos y mejorar sus estrategias de inversión.
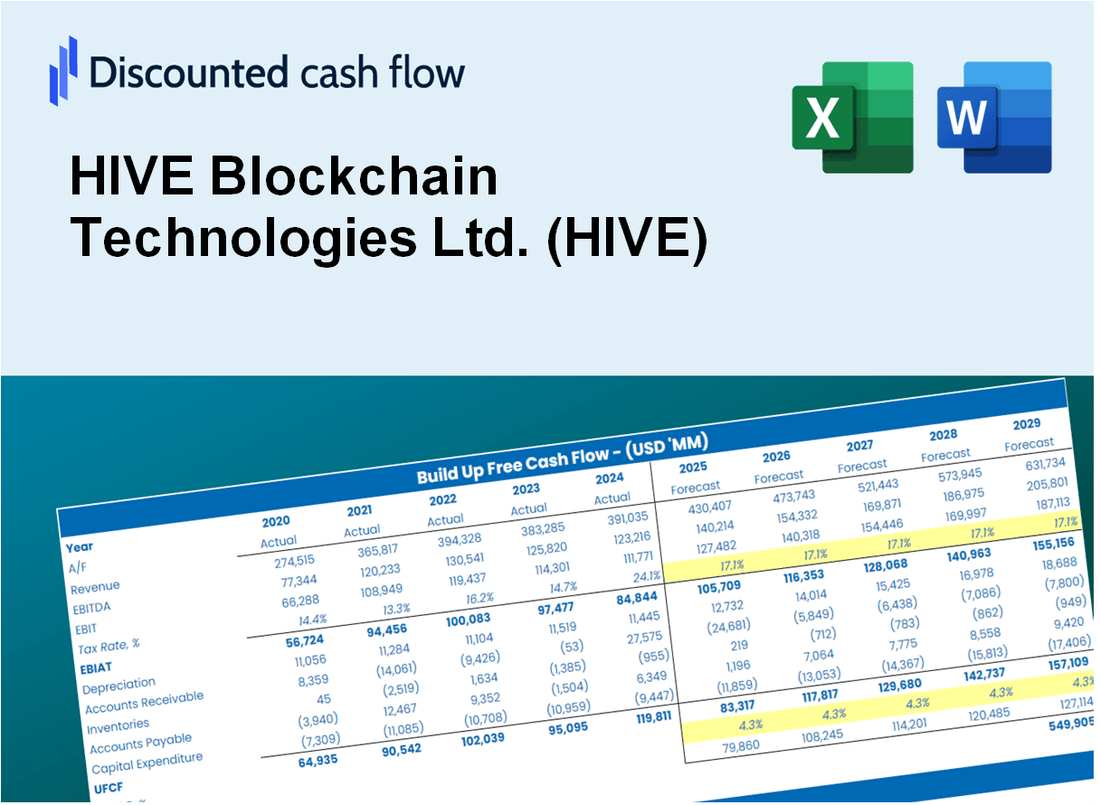
Discounted Cash Flow (DCF) - (USD MM)
| Year | AY1 2021 |
AY2 2022 |
AY3 2023 |
AY4 2024 |
AY5 2025 |
FY1 2026 |
FY2 2027 |
FY3 2028 |
FY4 2029 |
FY5 2030 |
|---|---|---|---|---|---|---|---|---|---|---|
| Revenue | 67.7 | 211.2 | 106.3 | 114.5 | 115.3 | 132.2 | 151.6 | 173.9 | 199.4 | 228.7 |
| Revenue Growth, % | 0 | 211.97 | -49.66 | 7.66 | 0.71113 | 14.68 | 14.68 | 14.68 | 14.68 | 14.68 |
| EBITDA | 62.5 | 143.9 | -46.0 | 96.7 | 28.9 | 60.0 | 68.8 | 78.9 | 90.4 | 103.7 |
| EBITDA, % | 92.36 | 68.14 | -43.26 | 84.5 | 25.06 | 45.36 | 45.36 | 45.36 | 45.36 | 45.36 |
| Depreciation | 8.5 | 64.6 | 79.2 | 61.4 | 62.1 | 59.5 | 68.3 | 78.3 | 89.8 | 103.0 |
| Depreciation, % | 12.54 | 30.6 | 74.51 | 53.66 | 53.86 | 45.03 | 45.03 | 45.03 | 45.03 | 45.03 |
| EBIT | 54.0 | 79.3 | -125.2 | 35.3 | -33.2 | 5.1 | 5.9 | 6.7 | 7.7 | 8.9 |
| EBIT, % | 79.82 | 37.54 | -117.77 | 30.84 | -28.8 | 3.88 | 3.88 | 3.88 | 3.88 | 3.88 |
| Total Cash | 41.3 | 22.3 | 7.2 | 16.7 | 47.5 | 35.5 | 40.7 | 46.6 | 53.5 | 61.3 |
| Total Cash, percent | .0 | .0 | .0 | .0 | .0 | .0 | .0 | .0 | .0 | .0 |
| Account Receivables | .0 | 8.0 | .0 | .0 | 15.3 | 4.5 | 5.2 | 5.9 | 6.8 | 7.8 |
| Account Receivables, % | 0 | 3.78 | 0 | 0 | 13.31 | 3.42 | 3.42 | 3.42 | 3.42 | 3.42 |
| Inventories | 57.5 | 170.0 | .0 | .0 | 181.1 | 70.2 | 80.5 | 92.3 | 105.8 | 121.4 |
| Inventories, % | 84.94 | 80.5 | 0 | 0 | 157.14 | 53.09 | 53.09 | 53.09 | 53.09 | 53.09 |
| Accounts Payable | 3.5 | 7.8 | 6.9 | 7.5 | 11.7 | 8.4 | 9.7 | 11.1 | 12.7 | 14.6 |
| Accounts Payable, % | 5.14 | 3.68 | 6.45 | 6.52 | 10.11 | 6.38 | 6.38 | 6.38 | 6.38 | 6.38 |
| Capital Expenditure | -65.2 | -215.0 | -42.8 | -79.3 | -174.3 | -107.3 | -123.1 | -141.1 | -161.9 | -185.6 |
| Capital Expenditure, % | -96.38 | -101.83 | -40.28 | -69.24 | -151.2 | -81.18 | -81.18 | -81.18 | -81.18 | -81.18 |
| Tax Rate, % | 285.86 | 285.86 | 285.86 | 285.86 | 285.86 | 285.86 | 285.86 | 285.86 | 285.86 | 285.86 |
| EBITAT | 53.7 | 76.9 | -125.4 | 28.6 | 61.7 | 3.9 | 4.4 | 5.1 | 5.8 | 6.7 |
| Depreciation | ||||||||||
| Changes in Account Receivables | ||||||||||
| Changes in Inventories | ||||||||||
| Changes in Accounts Payable | ||||||||||
| Capital Expenditure | ||||||||||
| UFCF | -57.1 | -189.7 | 88.1 | 11.4 | -242.8 | 74.7 | -60.1 | -68.9 | -79.0 | -90.6 |
| WACC, % | 22.25 | 22.24 | 22.25 | 22.16 | 21.78 | 22.14 | 22.14 | 22.14 | 22.14 | 22.14 |
| PV UFCF | ||||||||||
| SUM PV UFCF | -85.8 | |||||||||
| Long Term Growth Rate, % | 2.00 | |||||||||
| Free cash flow (T + 1) | -92 | |||||||||
| Terminal Value | -459 | |||||||||
| Present Terminal Value | -169 | |||||||||
| Enterprise Value | -255 | |||||||||
| Net Debt | 32 | |||||||||
| Equity Value | -287 | |||||||||
| Diluted Shares Outstanding, MM | 128 | |||||||||
| Equity Value Per Share | -2.24 |
What You Will Get
- Editable Excel Template: A fully customizable Excel-based DCF Calculator featuring pre-filled real HIVE financials.
- Real-World Data: Historical data and forward-looking estimates (as indicated in the yellow cells).
- Forecast Flexibility: Modify forecast assumptions such as revenue growth, EBITDA %, and WACC.
- Automatic Calculations: Instantly observe the effect of your inputs on HIVE’s valuation.
- Professional Tool: Designed for investors, CFOs, consultants, and financial analysts.
- User-Friendly Design: Organized for clarity and ease of use, complete with step-by-step instructions.
Key Features
- Accurate HIVE Financials: Gain access to reliable pre-loaded historical data and forward-looking projections.
- Customizable Forecast Assumptions: Modify highlighted cells for metrics like WACC, growth rates, and profit margins.
- Dynamic Calculations: Real-time updates for DCF, Net Present Value (NPV), and cash flow assessments.
- Visual Dashboard: User-friendly charts and summaries to easily interpret your valuation outcomes.
- For All Skill Levels: A straightforward, intuitive layout designed for investors, CFOs, and consultants.
How It Works
- Step 1: Download the prebuilt Excel template featuring HIVE Blockchain Technologies Ltd. (HIVE) data.
- Step 2: Navigate through the pre-filled sheets to familiarize yourself with the essential metrics.
- Step 3: Adjust forecasts and assumptions in the editable yellow cells (WACC, growth, margins).
- Step 4: Instantly see the recalculated results, including HIVE's intrinsic value.
- Step 5: Make informed investment choices or create reports based on the outputs.
Why Choose This Calculator for HIVE Blockchain Technologies Ltd. (HIVE)?
- Designed for Industry Experts: A specialized tool utilized by blockchain analysts, CFOs, and financial consultants.
- Up-to-Date Data: HIVE’s historical and projected financials integrated for precise calculations.
- Flexible Scenario Analysis: Effortlessly test various forecasts and assumptions.
- Comprehensive Outputs: Automatically computes intrinsic value, NPV, and essential metrics.
- User-Friendly Interface: Clear instructions that lead you through each step of the process.
Who Should Use This Product?
- Investors: Evaluate HIVE’s performance and potential before making investment decisions.
- CFOs and Financial Analysts: Optimize valuation methods and analyze financial forecasts for HIVE.
- Startup Founders: Gain insights into how blockchain companies like HIVE are valued in the market.
- Consultants: Provide expert valuation assessments and reports for clients interested in HIVE.
- Students and Educators: Utilize real-world examples to learn and teach valuation strategies related to HIVE.
What the Template Contains
- Pre-Filled DCF Model: HIVE Blockchain Technologies Ltd.’s (HIVE) financial data preloaded for immediate use.
- WACC Calculator: Detailed calculations for Weighted Average Cost of Capital.
- Financial Ratios: Evaluate HIVE’s profitability, leverage, and efficiency.
- Editable Inputs: Change assumptions such as growth, margins, and CAPEX to fit your scenarios.
- Financial Statements: Annual and quarterly reports to support detailed analysis.
- Interactive Dashboard: Easily visualize key valuation metrics and results.
Disclaimer
All information, articles, and product details provided on this website are for general informational and educational purposes only. We do not claim any ownership over, nor do we intend to infringe upon, any trademarks, copyrights, logos, brand names, or other intellectual property mentioned or depicted on this site. Such intellectual property remains the property of its respective owners, and any references here are made solely for identification or informational purposes, without implying any affiliation, endorsement, or partnership.
We make no representations or warranties, express or implied, regarding the accuracy, completeness, or suitability of any content or products presented. Nothing on this website should be construed as legal, tax, investment, financial, medical, or other professional advice. In addition, no part of this site—including articles or product references—constitutes a solicitation, recommendation, endorsement, advertisement, or offer to buy or sell any securities, franchises, or other financial instruments, particularly in jurisdictions where such activity would be unlawful.
All content is of a general nature and may not address the specific circumstances of any individual or entity. It is not a substitute for professional advice or services. Any actions you take based on the information provided here are strictly at your own risk. You accept full responsibility for any decisions or outcomes arising from your use of this website and agree to release us from any liability in connection with your use of, or reliance upon, the content or products found herein.