
|
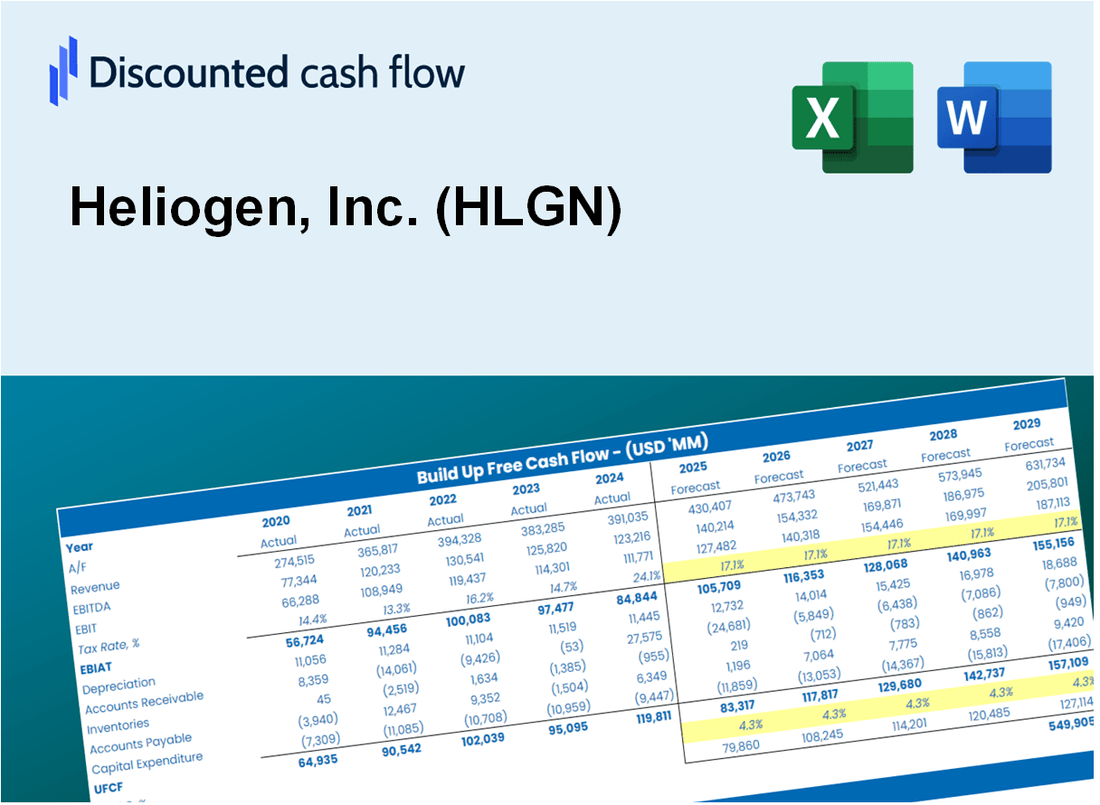
Valoración DCF de Heliogen, Inc. (HLGN) |
Completamente Editable: Adáptelo A Sus Necesidades En Excel O Sheets
Diseño Profesional: Plantillas Confiables Y Estándares De La Industria
Predeterminadas Para Un Uso Rápido Y Eficiente
Compatible con MAC / PC, completamente desbloqueado
No Se Necesita Experiencia; Fáciles De Seguir
Heliogen, Inc. (HLGN) Bundle
¡Agilice su análisis y mejore la precisión con nuestra calculadora HLGN DCF! Utilizando datos reales de Heliogen, Inc. y suposiciones personalizables, esta herramienta le permite pronosticar, evaluar y valorar Heliogen, Inc. como un inversor experimentado.
What You Will Get
- Editable Excel Template: A fully customizable Excel-based DCF Calculator featuring pre-filled real Heliogen, Inc. (HLGN) financials.
- Real-World Data: Historical data and forward-looking estimates (as indicated in the highlighted cells).
- Forecast Flexibility: Adjust forecast assumptions such as revenue growth, EBITDA %, and WACC.
- Automatic Calculations: Instantly observe how your inputs affect Heliogen, Inc. (HLGN)'s valuation.
- Professional Tool: Designed for investors, CFOs, consultants, and financial analysts.
- User-Friendly Design: Organized for clarity and ease of use, complete with step-by-step instructions.
Key Features
- Comprehensive Data: Heliogen, Inc.'s historical financial data and projected forecasts.
- Customizable Parameters: Modify WACC, tax rates, revenue growth, and EBITDA margins to suit your analysis.
- Real-Time Analysis: Observe Heliogen's intrinsic value recalculating instantly.
- Intuitive Visualizations: Dashboard graphs present valuation outcomes and essential metrics clearly.
- Designed for Precision: A robust tool tailored for analysts, investors, and finance professionals.
How It Works
- Step 1: Download the prebuilt Excel template containing Heliogen, Inc.'s (HLGN) data.
- Step 2: Review the pre-filled sheets to familiarize yourself with the essential metrics.
- Step 3: Modify forecasts and assumptions in the editable yellow cells (WACC, growth, margins).
- Step 4: Instantly see the recalculated results, including Heliogen, Inc.'s (HLGN) intrinsic value.
- Step 5: Make informed investment choices or create reports based on the outputs.
Why Choose This Calculator for Heliogen, Inc. (HLGN)?
- Designed for Experts: A sophisticated tool utilized by energy analysts, CFOs, and industry consultants.
- Accurate Data: Heliogen’s historical and projected financials preloaded for precise calculations.
- Flexible Scenario Analysis: Effortlessly simulate various forecasts and assumptions.
- Comprehensive Outputs: Automatically computes intrinsic value, NPV, and essential metrics.
- User-Friendly: Step-by-step guidance ensures a smooth calculation process.
Who Should Use Heliogen, Inc. (HLGN)?
- Renewable Energy Students: Explore innovative solar concentration techniques and apply them to real-world scenarios.
- Researchers: Integrate cutting-edge solar technology models into academic studies or projects.
- Investors: Evaluate your investment strategies and assess the potential of Heliogen, Inc. (HLGN) in the renewable energy sector.
- Energy Analysts: Enhance your analysis with a customizable model focused on solar energy solutions.
- Entrepreneurs: Understand how emerging companies like Heliogen, Inc. (HLGN) are shaping the future of energy production.
What the Template Contains
- Pre-Filled DCF Model: Heliogen, Inc.'s (HLGN) financial data preloaded for immediate use.
- WACC Calculator: Detailed calculations for Weighted Average Cost of Capital specific to Heliogen, Inc. (HLGN).
- Financial Ratios: Evaluate Heliogen, Inc.'s (HLGN) profitability, leverage, and efficiency.
- Editable Inputs: Change assumptions such as growth, margins, and CAPEX to fit your scenarios for Heliogen, Inc. (HLGN).
- Financial Statements: Annual and quarterly reports to support detailed analysis of Heliogen, Inc. (HLGN).
- Interactive Dashboard: Easily visualize key valuation metrics and results for Heliogen, Inc. (HLGN).
Disclaimer
All information, articles, and product details provided on this website are for general informational and educational purposes only. We do not claim any ownership over, nor do we intend to infringe upon, any trademarks, copyrights, logos, brand names, or other intellectual property mentioned or depicted on this site. Such intellectual property remains the property of its respective owners, and any references here are made solely for identification or informational purposes, without implying any affiliation, endorsement, or partnership.
We make no representations or warranties, express or implied, regarding the accuracy, completeness, or suitability of any content or products presented. Nothing on this website should be construed as legal, tax, investment, financial, medical, or other professional advice. In addition, no part of this site—including articles or product references—constitutes a solicitation, recommendation, endorsement, advertisement, or offer to buy or sell any securities, franchises, or other financial instruments, particularly in jurisdictions where such activity would be unlawful.
All content is of a general nature and may not address the specific circumstances of any individual or entity. It is not a substitute for professional advice or services. Any actions you take based on the information provided here are strictly at your own risk. You accept full responsibility for any decisions or outcomes arising from your use of this website and agree to release us from any liability in connection with your use of, or reliance upon, the content or products found herein.