
|
Valoración DCF de Helix Energy Solutions Group, Inc. (HLX) |
Completamente Editable: Adáptelo A Sus Necesidades En Excel O Sheets
Diseño Profesional: Plantillas Confiables Y Estándares De La Industria
Predeterminadas Para Un Uso Rápido Y Eficiente
Compatible con MAC / PC, completamente desbloqueado
No Se Necesita Experiencia; Fáciles De Seguir
Helix Energy Solutions Group, Inc. (HLX) Bundle
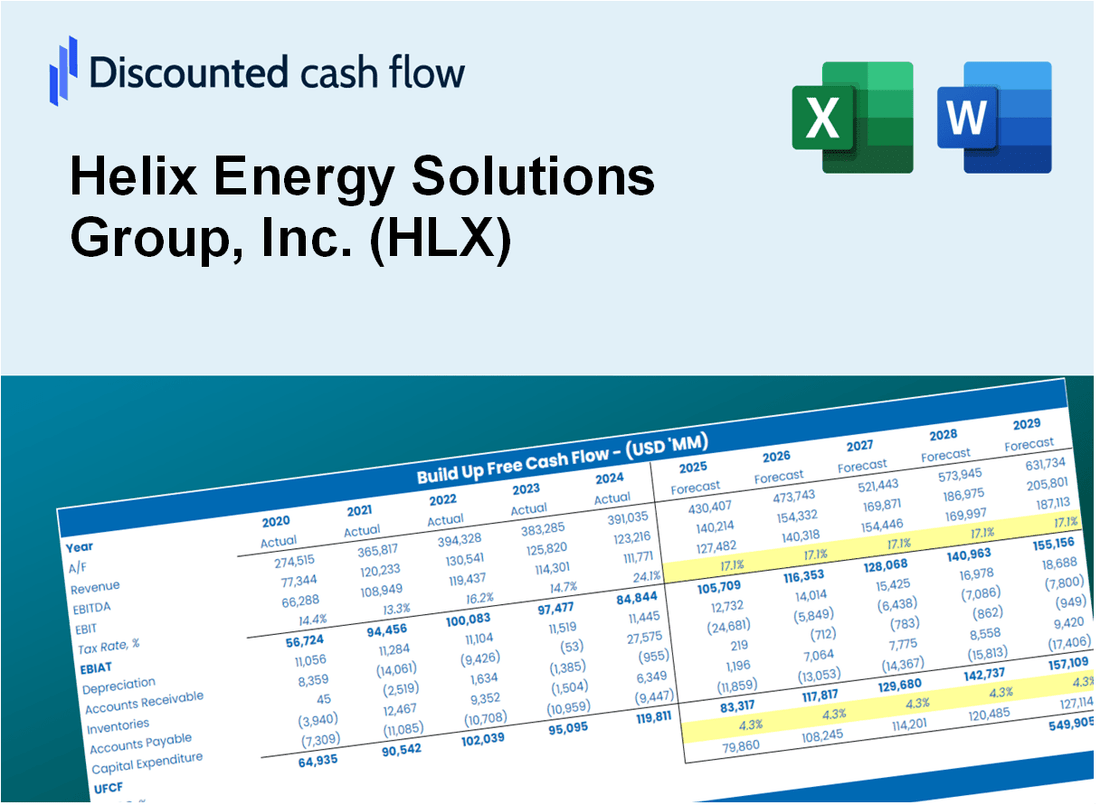
¡Evalúe Helix Energy Solutions Group, Inc. (HLX) Financial Outlook como un experto! Esta calculadora DCF (HLX) le proporciona datos financieros preconsados y la flexibilidad para modificar el crecimiento de los ingresos, WACC, los márgenes y otros supuestos cruciales para alinearse con sus predicciones.
Discounted Cash Flow (DCF) - (USD MM)
| Year | AY1 2020 |
AY2 2021 |
AY3 2022 |
AY4 2023 |
AY5 2024 |
FY1 2025 |
FY2 2026 |
FY3 2027 |
FY4 2028 |
FY5 2029 |
|---|---|---|---|---|---|---|---|---|---|---|
| Revenue | 733.6 | 674.7 | 873.1 | 1,289.7 | 1,358.6 | 1,611.4 | 1,911.2 | 2,266.9 | 2,688.7 | 3,189.1 |
| Revenue Growth, % | 0 | -8.02 | 29.4 | 47.72 | 5.34 | 18.61 | 18.61 | 18.61 | 18.61 | 18.61 |
| EBITDA | 164.5 | 94.4 | 87.7 | 193.0 | 253.2 | 258.0 | 306.0 | 362.9 | 430.4 | 510.5 |
| EBITDA, % | 22.42 | 13.99 | 10.04 | 14.96 | 18.63 | 16.01 | 16.01 | 16.01 | 16.01 | 16.01 |
| Depreciation | 133.7 | 141.5 | 142.7 | 164.1 | 137.2 | 252.6 | 299.6 | 355.3 | 421.4 | 499.8 |
| Depreciation, % | 18.23 | 20.97 | 16.34 | 12.72 | 10.1 | 15.67 | 15.67 | 15.67 | 15.67 | 15.67 |
| EBIT | 30.7 | -47.2 | -55.0 | 28.9 | 116.0 | 5.4 | 6.4 | 7.6 | 9.0 | 10.7 |
| EBIT, % | 4.19 | -6.99 | -6.3 | 2.24 | 8.54 | 0.3354 | 0.3354 | 0.3354 | 0.3354 | 0.3354 |
| Total Cash | 291.3 | 253.5 | 186.6 | 332.2 | 368.0 | 488.3 | 579.1 | 686.9 | 814.7 | 966.3 |
| Total Cash, percent | .0 | .0 | .0 | .0 | .0 | .0 | .0 | .0 | .0 | .0 |
| Account Receivables | 185.2 | 174.7 | 219.1 | 286.3 | 273.5 | 382.1 | 453.2 | 537.5 | 637.6 | 756.2 |
| Account Receivables, % | 25.25 | 25.89 | 25.09 | 22.19 | 20.13 | 23.71 | 23.71 | 23.71 | 23.71 | 23.71 |
| Inventories | .0 | .0 | 2.5 | .0 | .0 | .9 | 1.1 | 1.3 | 1.5 | 1.8 |
| Inventories, % | 0 | 0 | 0.28714 | 0 | 0 | 0.05742756 | 0.05742756 | 0.05742756 | 0.05742756 | 0.05742756 |
| Accounts Payable | 50.0 | 88.0 | 135.3 | 134.6 | 144.8 | 181.9 | 215.7 | 255.9 | 303.5 | 360.0 |
| Accounts Payable, % | 6.82 | 13.04 | 15.49 | 10.43 | 10.66 | 11.29 | 11.29 | 11.29 | 11.29 | 11.29 |
| Capital Expenditure | -20.2 | -8.3 | -33.5 | -19.6 | -23.3 | -35.7 | -42.3 | -50.2 | -59.5 | -70.6 |
| Capital Expenditure, % | -2.76 | -1.23 | -3.84 | -1.52 | -1.72 | -2.21 | -2.21 | -2.21 | -2.21 | -2.21 |
| Tax Rate, % | 32.2 | 32.2 | 32.2 | 32.2 | 32.2 | 32.2 | 32.2 | 32.2 | 32.2 | 32.2 |
| EBITAT | 492.9 | -41.2 | -64.2 | -41.6 | 78.6 | 3.8 | 4.6 | 5.4 | 6.4 | 7.6 |
| Depreciation | ||||||||||
| Changes in Account Receivables | ||||||||||
| Changes in Inventories | ||||||||||
| Changes in Accounts Payable | ||||||||||
| Capital Expenditure | ||||||||||
| UFCF | 471.1 | 140.5 | 45.4 | 37.5 | 215.5 | 148.3 | 224.4 | 266.1 | 315.7 | 374.4 |
| WACC, % | 7.92 | 7.67 | 7.92 | 5.94 | 7.28 | 7.35 | 7.35 | 7.35 | 7.35 | 7.35 |
| PV UFCF | ||||||||||
| SUM PV UFCF | 1,048.5 | |||||||||
| Long Term Growth Rate, % | 4.00 | |||||||||
| Free cash flow (T + 1) | 389 | |||||||||
| Terminal Value | 11,639 | |||||||||
| Present Terminal Value | 8,165 | |||||||||
| Enterprise Value | 9,214 | |||||||||
| Net Debt | 293 | |||||||||
| Equity Value | 8,921 | |||||||||
| Diluted Shares Outstanding, MM | 155 | |||||||||
| Equity Value Per Share | 57.66 |
What You Will Receive
- Customizable Excel Template: A fully adaptable Excel-based DCF Calculator featuring pre-filled real HLX financials.
- Accurate Data: Historical performance data and forward-looking projections (as indicated in the highlighted cells).
- Adjustable Forecasts: Modify key assumptions such as revenue growth, EBITDA %, and WACC.
- Instant Calculations: Quickly observe how your inputs influence Helix Energy's valuation.
- Professional Resource: Designed for investors, CFOs, consultants, and financial analysts.
- User-Centric Layout: Organized for clarity and ease of navigation, complete with step-by-step guidance.
Key Features
- Comprehensive HLX Data: Pre-filled with Helix Energy Solutions' historical performance and forward-looking estimates.
- Customizable Parameters: Modify growth rates, margins, discount rates, tax implications, and capital investments.
- Interactive Valuation Model: Automatic recalculations of Net Present Value (NPV) and intrinsic value based on user inputs.
- Scenario Analysis: Develop various forecasting scenarios to evaluate different valuation results.
- Intuitive Interface: Clean, organized design suitable for both industry experts and newcomers.
How It Works
- Step 1: Download the Excel file for Helix Energy Solutions Group, Inc. (HLX).
- Step 2: Review Helix’s pre-filled financial data and forecasts.
- Step 3: Modify key inputs such as revenue growth, WACC, and tax rates (highlighted cells).
- Step 4: Observe the DCF model update in real-time as you adjust your assumptions.
- Step 5: Analyze the outputs and leverage the results for informed investment decisions.
Why Choose Helix Energy Solutions Group, Inc. (HLX) Calculator?
- Accuracy: Utilizes real Helix financial data for precise calculations.
- Flexibility: Allows users to easily adjust and test various input parameters.
- Time-Saving: Eliminate the need to construct a financial model from the ground up.
- Professional-Grade: Crafted with the expertise and detail expected at the CFO level.
- User-Friendly: Intuitive interface suitable for users without extensive financial modeling skills.
Who Should Use Helix Energy Solutions Group, Inc. (HLX)?
- Energy Sector Students: Explore industry-specific valuation methods and apply them to real-world scenarios.
- Researchers: Integrate advanced models into academic studies or energy market research.
- Investors: Validate your investment strategies and assess valuation metrics for Helix Energy Solutions Group, Inc. (HLX).
- Financial Analysts: Enhance your analysis process with a customizable DCF model tailored for the energy sector.
- Business Owners: Understand the valuation practices of leading energy companies like Helix Energy Solutions Group, Inc. (HLX).
What the Template Contains
- Operating and Balance Sheet Data: Pre-filled Helix Energy Solutions Group, Inc. (HLX) historical data and forecasts, including revenue, EBITDA, EBIT, and capital expenditures.
- WACC Calculation: A dedicated sheet for Weighted Average Cost of Capital (WACC), including parameters like Beta, risk-free rate, and share price.
- DCF Valuation (Unlevered and Levered): Editable Discounted Cash Flow models showing intrinsic value with detailed calculations.
- Financial Statements: Pre-loaded financial statements (annual and quarterly) to support analysis.
- Key Ratios: Includes profitability, leverage, and efficiency ratios for Helix Energy Solutions Group, Inc. (HLX).
- Dashboard and Charts: Visual summary of valuation outputs and assumptions to analyze results easily.
Disclaimer
All information, articles, and product details provided on this website are for general informational and educational purposes only. We do not claim any ownership over, nor do we intend to infringe upon, any trademarks, copyrights, logos, brand names, or other intellectual property mentioned or depicted on this site. Such intellectual property remains the property of its respective owners, and any references here are made solely for identification or informational purposes, without implying any affiliation, endorsement, or partnership.
We make no representations or warranties, express or implied, regarding the accuracy, completeness, or suitability of any content or products presented. Nothing on this website should be construed as legal, tax, investment, financial, medical, or other professional advice. In addition, no part of this site—including articles or product references—constitutes a solicitation, recommendation, endorsement, advertisement, or offer to buy or sell any securities, franchises, or other financial instruments, particularly in jurisdictions where such activity would be unlawful.
All content is of a general nature and may not address the specific circumstances of any individual or entity. It is not a substitute for professional advice or services. Any actions you take based on the information provided here are strictly at your own risk. You accept full responsibility for any decisions or outcomes arising from your use of this website and agree to release us from any liability in connection with your use of, or reliance upon, the content or products found herein.