
|
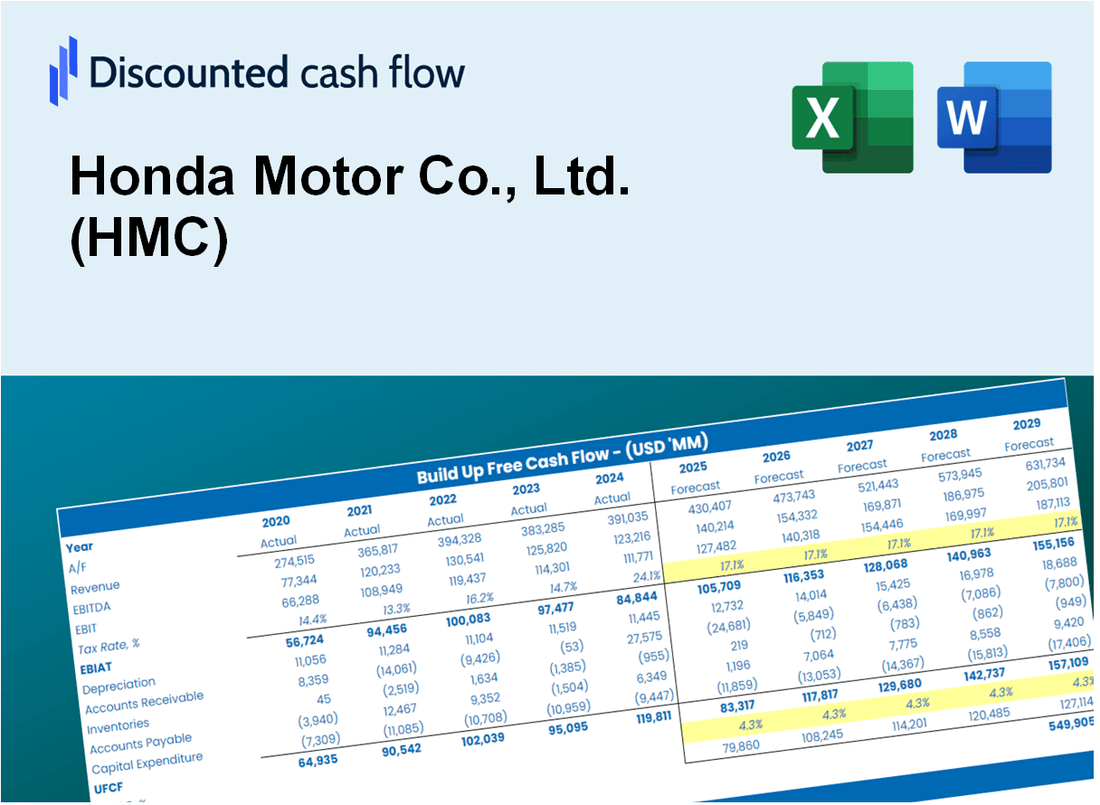
Valoración DCF de Honda Motor Co., Ltd. (HMC) |
Completamente Editable: Adáptelo A Sus Necesidades En Excel O Sheets
Diseño Profesional: Plantillas Confiables Y Estándares De La Industria
Predeterminadas Para Un Uso Rápido Y Eficiente
Compatible con MAC / PC, completamente desbloqueado
No Se Necesita Experiencia; Fáciles De Seguir
Honda Motor Co., Ltd. (HMC) Bundle
¡Explore el potencial financiero de Honda Motor Co., Ltd. (HMC) con nuestra calculadora DCF fácil de usar! Ingrese sus proyecciones para el crecimiento, los márgenes y los gastos para determinar el valor intrínseco de Honda Motor Co., Ltd. (HMC) e informar sus decisiones de inversión.
Discounted Cash Flow (DCF) - (USD MM)
| Year | AY1 2021 |
AY2 2022 |
AY3 2023 |
AY4 2024 |
AY5 2025 |
FY1 2026 |
FY2 2027 |
FY3 2028 |
FY4 2029 |
FY5 2030 |
|---|---|---|---|---|---|---|---|---|---|---|
| Revenue | 89,429.9 | 98,815.1 | 114,806.1 | 138,714.8 | 147,270.1 | 167,030.1 | 189,441.4 | 214,859.8 | 243,688.7 | 276,385.6 |
| Revenue Growth, % | 0 | 10.49 | 16.18 | 20.83 | 6.17 | 13.42 | 13.42 | 13.42 | 13.42 | 13.42 |
| EBITDA | 14,125.7 | 16,034.6 | 10,201.5 | 21,529.4 | 14,364.0 | 22,108.8 | 25,075.3 | 28,439.8 | 32,255.7 | 36,583.6 |
| EBITDA, % | 15.8 | 16.23 | 8.89 | 15.52 | 9.75 | 13.24 | 13.24 | 13.24 | 13.24 | 13.24 |
| Depreciation | 9,676.8 | 10,028.4 | 10,843.0 | 10,725.0 | 5,044.2 | 13,887.1 | 15,750.4 | 17,863.7 | 20,260.6 | 22,979.0 |
| Depreciation, % | 10.82 | 10.15 | 9.44 | 7.73 | 3.43 | 8.31 | 8.31 | 8.31 | 8.31 | 8.31 |
| EBIT | 4,448.9 | 6,006.2 | -641.5 | 10,804.5 | 9,319.8 | 8,221.7 | 9,324.9 | 10,576.1 | 11,995.1 | 13,604.5 |
| EBIT, % | 4.97 | 6.08 | -0.55878 | 7.79 | 6.33 | 4.92 | 4.92 | 4.92 | 4.92 | 4.92 |
| Total Cash | 20,732.6 | 26,431.9 | 27,614.9 | 35,201.2 | 32,166.8 | 40,489.5 | 45,922.2 | 52,083.8 | 59,072.1 | 66,998.2 |
| Total Cash, percent | .0 | .0 | .0 | .0 | .0 | .0 | .0 | .0 | .0 | .0 |
| Account Receivables | 17,630.4 | 17,592.5 | 20,097.3 | 25,793.7 | 26,594.6 | 30,625.4 | 34,734.6 | 39,395.1 | 44,680.9 | 50,676.0 |
| Account Receivables, % | 19.71 | 17.8 | 17.51 | 18.59 | 18.06 | 18.34 | 18.34 | 18.34 | 18.34 | 18.34 |
| Inventories | 10,494.9 | 13,027.2 | 14,715.5 | 16,588.1 | 16,775.7 | 20,406.4 | 23,144.5 | 26,249.9 | 29,771.9 | 33,766.6 |
| Inventories, % | 11.74 | 13.18 | 12.82 | 11.96 | 11.39 | 12.22 | 12.22 | 12.22 | 12.22 | 12.22 |
| Accounts Payable | 7,388.1 | 8,394.2 | 9,685.0 | 10,931.0 | 11,295.3 | 13,610.4 | 15,436.5 | 17,507.7 | 19,856.8 | 22,521.1 |
| Accounts Payable, % | 8.26 | 8.49 | 8.44 | 7.88 | 7.67 | 8.15 | 8.15 | 8.15 | 8.15 | 8.15 |
| Capital Expenditure | -3,742.3 | -3,050.3 | -4,294.7 | -4,132.9 | -5,754.2 | -5,979.4 | -6,781.6 | -7,691.6 | -8,723.6 | -9,894.1 |
| Capital Expenditure, % | -4.18 | -3.09 | -3.74 | -2.98 | -3.91 | -3.58 | -3.58 | -3.58 | -3.58 | -3.58 |
| Tax Rate, % | 36.57 | 36.57 | 36.57 | 36.57 | 36.57 | 36.57 | 36.57 | 36.57 | 36.57 | 36.57 |
| EBITAT | 3,199.8 | 3,968.3 | -475.1 | 7,283.6 | 5,912.0 | 5,638.5 | 6,395.0 | 7,253.1 | 8,226.3 | 9,330.0 |
| Depreciation | ||||||||||
| Changes in Account Receivables | ||||||||||
| Changes in Inventories | ||||||||||
| Changes in Accounts Payable | ||||||||||
| Capital Expenditure | ||||||||||
| UFCF | -11,602.9 | 9,458.0 | 3,171.0 | 7,552.6 | 4,577.7 | 8,199.8 | 10,342.8 | 11,730.5 | 13,304.5 | 15,089.6 |
| WACC, % | 3.53 | 3.39 | 3.58 | 3.42 | 3.33 | 3.45 | 3.45 | 3.45 | 3.45 | 3.45 |
| PV UFCF | ||||||||||
| SUM PV UFCF | 52,535.2 | |||||||||
| Long Term Growth Rate, % | 2.00 | |||||||||
| Free cash flow (T + 1) | 15,391 | |||||||||
| Terminal Value | 1,059,958 | |||||||||
| Present Terminal Value | 894,525 | |||||||||
| Enterprise Value | 947,060 | |||||||||
| Net Debt | -724 | |||||||||
| Equity Value | 947,784 | |||||||||
| Diluted Shares Outstanding, MM | 519 | |||||||||
| Equity Value Per Share | 1,826.02 |
What You Will Get
- Editable Forecast Inputs: Effortlessly modify key assumptions (growth %, margins, WACC) to explore various scenarios.
- Real-World Data: Honda’s financial information pre-loaded to facilitate your analysis.
- Automatic DCF Outputs: The template computes Net Present Value (NPV) and intrinsic value automatically.
- Customizable and Professional: A refined Excel model that adjusts to fit your valuation requirements.
- Built for Analysts and Investors: Perfect for evaluating projections, confirming strategies, and enhancing efficiency.
Key Features
- Comprehensive DCF Calculator: Features detailed unlevered and levered DCF valuation models tailored for Honda Motor Co., Ltd. (HMC).
- WACC Calculator: Pre-configured Weighted Average Cost of Capital sheet with adjustable inputs specific to Honda.
- Customizable Forecast Assumptions: Adjust growth rates, capital expenditures, and discount rates based on Honda's performance.
- Integrated Financial Ratios: Evaluate profitability, leverage, and efficiency ratios for Honda Motor Co., Ltd. (HMC).
- Interactive Dashboard and Charts: Visual representations that summarize essential valuation metrics for straightforward analysis.
How It Works
- Download: Access the ready-to-use Excel file containing Honda Motor Co., Ltd.'s (HMC) financial data.
- Customize: Modify forecasts, including sales growth, operating margin, and discount rate.
- Update Automatically: Intrinsic value and NPV calculations refresh in real-time.
- Test Scenarios: Develop various projections and compare results instantly.
- Make Decisions: Utilize the valuation outcomes to inform your investment strategy.
Why Choose Honda Motor Co., Ltd. (HMC)?
- Innovative Technology: Experience cutting-edge engineering and design in every vehicle.
- Exceptional Reliability: Honda is known for producing durable and dependable automobiles.
- Fuel Efficiency: Benefit from advanced fuel-saving technologies that reduce your carbon footprint.
- Comprehensive Safety Features: Drive with confidence thanks to Honda's commitment to safety and accident prevention.
- Global Reputation: Join millions of satisfied customers who trust Honda for quality and performance.
Who Should Use This Product?
- Individual Investors: Make informed decisions about buying or selling Honda stock (HMC).
- Financial Analysts: Streamline valuation processes with ready-to-use financial models for Honda (HMC).
- Consultants: Deliver professional valuation insights on Honda (HMC) to clients quickly and accurately.
- Business Owners: Understand how major automotive companies like Honda (HMC) are valued to guide your own strategy.
- Finance Students: Learn valuation techniques using real-world data and scenarios related to Honda (HMC).
What the Template Contains
- Pre-Filled DCF Model: Honda’s financial data preloaded for immediate use.
- WACC Calculator: Detailed calculations for Weighted Average Cost of Capital.
- Financial Ratios: Evaluate Honda’s profitability, leverage, and efficiency.
- Editable Inputs: Change assumptions such as growth, margins, and CAPEX to fit your scenarios.
- Financial Statements: Annual and quarterly reports to support detailed analysis.
- Interactive Dashboard: Easily visualize key valuation metrics and results.
Disclaimer
All information, articles, and product details provided on this website are for general informational and educational purposes only. We do not claim any ownership over, nor do we intend to infringe upon, any trademarks, copyrights, logos, brand names, or other intellectual property mentioned or depicted on this site. Such intellectual property remains the property of its respective owners, and any references here are made solely for identification or informational purposes, without implying any affiliation, endorsement, or partnership.
We make no representations or warranties, express or implied, regarding the accuracy, completeness, or suitability of any content or products presented. Nothing on this website should be construed as legal, tax, investment, financial, medical, or other professional advice. In addition, no part of this site—including articles or product references—constitutes a solicitation, recommendation, endorsement, advertisement, or offer to buy or sell any securities, franchises, or other financial instruments, particularly in jurisdictions where such activity would be unlawful.
All content is of a general nature and may not address the specific circumstances of any individual or entity. It is not a substitute for professional advice or services. Any actions you take based on the information provided here are strictly at your own risk. You accept full responsibility for any decisions or outcomes arising from your use of this website and agree to release us from any liability in connection with your use of, or reliance upon, the content or products found herein.