
|
Valoración de DCF HMT Limited (HMT.NS) |
Completamente Editable: Adáptelo A Sus Necesidades En Excel O Sheets
Diseño Profesional: Plantillas Confiables Y Estándares De La Industria
Predeterminadas Para Un Uso Rápido Y Eficiente
Compatible con MAC / PC, completamente desbloqueado
No Se Necesita Experiencia; Fáciles De Seguir
HMT Limited (HMT.NS) Bundle
Diseñada para la precisión, nuestra calculadora DCF HMT Limited (HMTNS) le permite evaluar la valoración de HMT Limited utilizando datos financieros del mundo real, ofreciendo una flexibilidad completa para modificar todos los parámetros clave para mejorar las proyecciones.
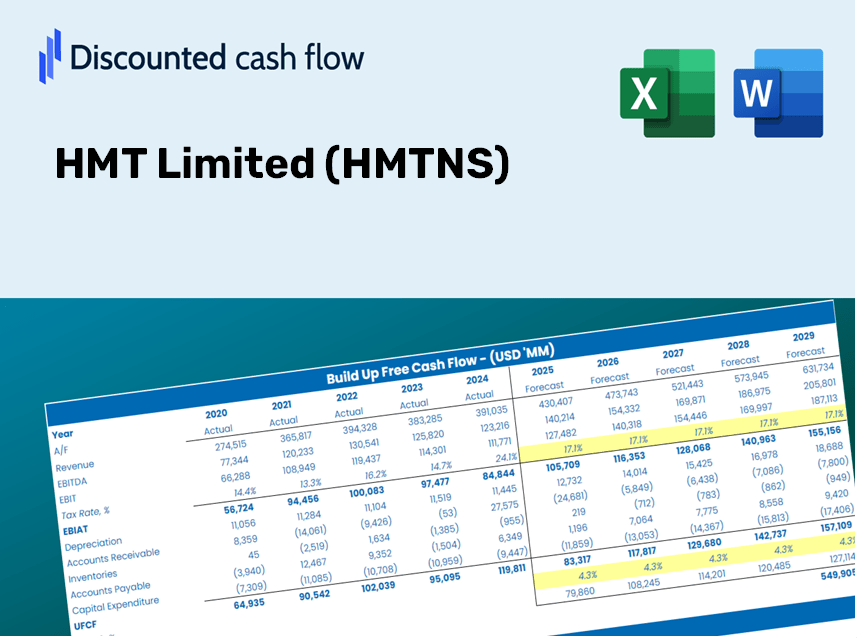
Discounted Cash Flow (DCF) - (USD MM)
| Year | AY1 2021 |
AY2 2022 |
AY3 2023 |
AY4 2024 |
AY5 2025 |
FY1 2026 |
FY2 2027 |
FY3 2028 |
FY4 2029 |
FY5 2030 |
|---|---|---|---|---|---|---|---|---|---|---|
| Revenue | 2,038.9 | 1,757.4 | 2,038.1 | 1,633.9 | 1,423.1 | 1,314.4 | 1,213.9 | 1,121.1 | 1,035.5 | 956.3 |
| Revenue Growth, % | 0 | -13.81 | 15.97 | -19.83 | -12.9 | -7.64 | -7.64 | -7.64 | -7.64 | -7.64 |
| EBITDA | -145.5 | -609.7 | -386.6 | -566.7 | -629.4 | -367.3 | -339.2 | -313.3 | -289.3 | -267.2 |
| EBITDA, % | -7.14 | -34.69 | -18.97 | -34.69 | -44.23 | -27.94 | -27.94 | -27.94 | -27.94 | -27.94 |
| Depreciation | 94.7 | 96.1 | 91.3 | 82.8 | 74.6 | 65.5 | 60.5 | 55.8 | 51.6 | 47.6 |
| Depreciation, % | 4.65 | 5.47 | 4.48 | 5.07 | 5.24 | 4.98 | 4.98 | 4.98 | 4.98 | 4.98 |
| EBIT | -240.3 | -705.8 | -477.8 | -649.5 | -704.0 | -432.7 | -399.7 | -369.1 | -340.9 | -314.9 |
| EBIT, % | -11.78 | -40.16 | -23.44 | -39.75 | -49.47 | -32.92 | -32.92 | -32.92 | -32.92 | -32.92 |
| Total Cash | 1,906.1 | 1,356.9 | 2,539.8 | 2,465.2 | 2,101.1 | 1,237.3 | 1,142.8 | 1,055.4 | 974.8 | 900.3 |
| Total Cash, percent | .0 | .0 | .0 | .0 | .0 | .0 | .0 | .0 | .0 | .0 |
| Account Receivables | 2,284.8 | 2,280.5 | 2,335.6 | 422.5 | 1,240.2 | 1,085.7 | 1,002.7 | 926.1 | 855.3 | 790.0 |
| Account Receivables, % | 112.06 | 129.77 | 114.6 | 25.86 | 87.15 | 82.6 | 82.6 | 82.6 | 82.6 | 82.6 |
| Inventories | 1,721.1 | 1,430.6 | 1,178.0 | 1,160.2 | 966.0 | 952.9 | 880.1 | 812.8 | 750.7 | 693.4 |
| Inventories, % | 84.41 | 81.41 | 57.8 | 71.01 | 67.88 | 72.5 | 72.5 | 72.5 | 72.5 | 72.5 |
| Accounts Payable | 1,026.5 | 875.0 | 819.7 | 953.4 | 855.5 | 680.4 | 628.4 | 580.4 | 536.0 | 495.0 |
| Accounts Payable, % | 50.34 | 49.79 | 40.22 | 58.35 | 60.12 | 51.76 | 51.76 | 51.76 | 51.76 | 51.76 |
| Capital Expenditure | -20.7 | -47.2 | -57.5 | -38.3 | -22.1 | -27.4 | -25.3 | -23.4 | -21.6 | -19.9 |
| Capital Expenditure, % | -1.01 | -2.68 | -2.82 | -2.34 | -1.55 | -2.08 | -2.08 | -2.08 | -2.08 | -2.08 |
| Tax Rate, % | -2.13 | -2.13 | -2.13 | -2.13 | -2.13 | -2.13 | -2.13 | -2.13 | -2.13 | -2.13 |
| EBITAT | -244.3 | 2,589.9 | -502.8 | 12,455.0 | -719.0 | -259.6 | -239.8 | -221.5 | -204.5 | -188.9 |
| Depreciation | ||||||||||
| Changes in Account Receivables | ||||||||||
| Changes in Inventories | ||||||||||
| Changes in Accounts Payable | ||||||||||
| Capital Expenditure | ||||||||||
| UFCF | -3,149.6 | 2,782.2 | -326.9 | 14,564.2 | -1,387.9 | -229.1 | -100.8 | -93.1 | -86.0 | -79.4 |
| WACC, % | 4.93 | 4.04 | 4.93 | 4.04 | 4.93 | 4.58 | 4.58 | 4.58 | 4.58 | 4.58 |
| PV UFCF | ||||||||||
| SUM PV UFCF | -528.1 | |||||||||
| Long Term Growth Rate, % | 2.00 | |||||||||
| Free cash flow (T + 1) | -81 | |||||||||
| Terminal Value | -3,146 | |||||||||
| Present Terminal Value | -2,515 | |||||||||
| Enterprise Value | -3,043 | |||||||||
| Net Debt | 10,242 | |||||||||
| Equity Value | -13,285 | |||||||||
| Diluted Shares Outstanding, MM | 1,204 | |||||||||
| Equity Value Per Share | -11.03 |
What You Will Receive
- Authentic HMT Financial Data: Pre-populated with HMT Limited’s historical and projected figures for accurate assessments.
- Completely Customizable Template: Easily adjust essential inputs such as revenue growth, WACC, and EBITDA %.
- Instant Calculations: Watch HMT Limited’s intrinsic value update in real-time as you make modifications.
- Professional Valuation Tool: Tailored for investors, analysts, and consultants aiming for precise DCF results.
- Intuitive Design: A straightforward layout and clear guidelines suitable for all levels of expertise.
Key Features
- 🔍 Real-Life HMTNS Financials: Pre-filled historical and projected data for HMT Limited.
- ✏️ Fully Customizable Inputs: Modify all essential parameters (yellow cells) such as WACC, growth %, and tax rates.
- 📊 Professional DCF Valuation: Integrated formulas that calculate HMT’s intrinsic value using the Discounted Cash Flow method.
- ⚡ Instant Results: Immediately visualize HMT’s valuation following any adjustments.
- Scenario Analysis: Evaluate and compare different outcomes based on various financial assumptions side-by-side.
How It Functions
- Download the Template: Gain immediate access to the Excel-based HMT Limited (HMTNS) DCF Calculator.
- Input Your Assumptions: Modify the yellow-highlighted cells to set growth rates, WACC, profit margins, and other variables.
- Automatic Calculations: The model dynamically calculates HMT Limited's intrinsic value.
- Experiment with Scenarios: Test various assumptions to see how they impact potential valuations.
- Analyze and Make Decisions: Utilize the findings to inform your investment strategy or financial assessments.
Why Choose HMT Limited's Calculator?
- All-in-One Solution: Integrates DCF, WACC, and detailed financial ratio analyses seamlessly.
- Flexibly Configurable: Modify the highlighted cells to explore different financial scenarios.
- In-Depth Analysis: Automatically computes HMT Limited’s intrinsic value and Net Present Value.
- Rich Data Set: Comes with historical and projected data for reliable benchmarks.
- High-Caliber Tool: Perfect for financial analysts, investors, and business consultants aiming for precision.
Who Can Benefit from HMT Limited (HMTNS)?
- Investors: Assess HMT's valuation to inform their buying or selling decisions.
- CFOs and Financial Analysts: Optimize valuation workflows and evaluate forecasts.
- Startup Founders: Discover how prominent public companies like HMT are appraised.
- Consultants: Create detailed valuation reports for your clients based on HMT's metrics.
- Students and Educators: Utilize real-time data for practicing and teaching valuation methods.
Contents of the Template
- Preloaded HMT Limited Data: Historical and projected financial data, including revenue, EBIT, and capital expenditures.
- DCF and WACC Models: Professional-grade sheets for calculating intrinsic value and Weighted Average Cost of Capital.
- Editable Inputs: Yellow-highlighted cells for adjusting revenue growth, tax rates, and discount rates.
- Financial Statements: Comprehensive annual and quarterly financials for in-depth analysis.
- Key Ratios: Profitability, leverage, and efficiency ratios for performance evaluation.
- Dashboard and Charts: Visual summaries of valuation outcomes and assumptions.
Disclaimer
All information, articles, and product details provided on this website are for general informational and educational purposes only. We do not claim any ownership over, nor do we intend to infringe upon, any trademarks, copyrights, logos, brand names, or other intellectual property mentioned or depicted on this site. Such intellectual property remains the property of its respective owners, and any references here are made solely for identification or informational purposes, without implying any affiliation, endorsement, or partnership.
We make no representations or warranties, express or implied, regarding the accuracy, completeness, or suitability of any content or products presented. Nothing on this website should be construed as legal, tax, investment, financial, medical, or other professional advice. In addition, no part of this site—including articles or product references—constitutes a solicitation, recommendation, endorsement, advertisement, or offer to buy or sell any securities, franchises, or other financial instruments, particularly in jurisdictions where such activity would be unlawful.
All content is of a general nature and may not address the specific circumstances of any individual or entity. It is not a substitute for professional advice or services. Any actions you take based on the information provided here are strictly at your own risk. You accept full responsibility for any decisions or outcomes arising from your use of this website and agree to release us from any liability in connection with your use of, or reliance upon, the content or products found herein.