
|
Honeywell Automation India Limited (Honaut.NS) Valoración de DCF |
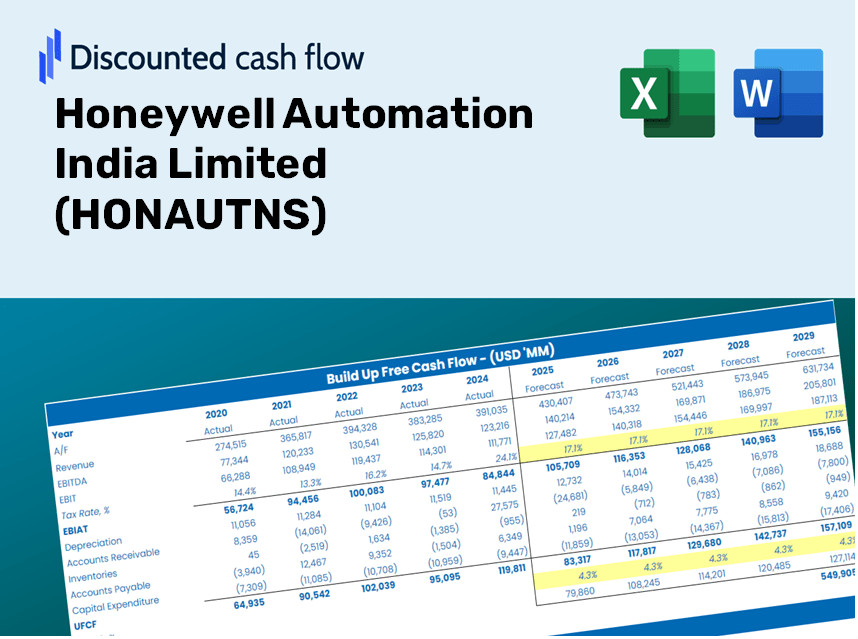
Completamente Editable: Adáptelo A Sus Necesidades En Excel O Sheets
Diseño Profesional: Plantillas Confiables Y Estándares De La Industria
Predeterminadas Para Un Uso Rápido Y Eficiente
Compatible con MAC / PC, completamente desbloqueado
No Se Necesita Experiencia; Fáciles De Seguir
Honeywell Automation India Limited (HONAUT.NS) Bundle
¡Mejore sus opciones de inversión con la calculadora DCF (Honautns)! Sumérgete en las finanzas reales de Honeywell Automation India Limited, ajusta las proyecciones y gastos de crecimiento, y observa cómo estas alteraciones afectan el valor intrínseco de (Honautns) en tiempo real.
Discounted Cash Flow (DCF) - (USD MM)
| Year | AY1 2021 |
AY2 2022 |
AY3 2023 |
AY4 2024 |
AY5 2025 |
FY1 2026 |
FY2 2027 |
FY3 2028 |
FY4 2029 |
FY5 2030 |
|---|---|---|---|---|---|---|---|---|---|---|
| Revenue | 30,427.8 | 29,483.2 | 34,476.0 | 40,582.0 | 41,896.0 | 45,538.7 | 49,498.2 | 53,801.9 | 58,479.8 | 63,564.4 |
| Revenue Growth, % | 0 | -3.1 | 16.93 | 17.71 | 3.24 | 8.69 | 8.69 | 8.69 | 8.69 | 8.69 |
| EBITDA | 5,800.8 | 4,124.8 | 4,998.0 | 5,719.0 | 5,658.0 | 6,844.4 | 7,439.5 | 8,086.3 | 8,789.4 | 9,553.6 |
| EBITDA, % | 19.06 | 13.99 | 14.5 | 14.09 | 13.5 | 15.03 | 15.03 | 15.03 | 15.03 | 15.03 |
| Depreciation | 270.3 | 317.1 | 328.0 | 362.0 | 356.0 | 424.1 | 461.0 | 501.1 | 544.7 | 592.0 |
| Depreciation, % | 0.88833 | 1.08 | 0.95139 | 0.89202 | 0.84972 | 0.9314 | 0.9314 | 0.9314 | 0.9314 | 0.9314 |
| EBIT | 5,530.5 | 3,807.7 | 4,670.0 | 5,357.0 | 5,302.0 | 6,420.2 | 6,978.4 | 7,585.2 | 8,244.7 | 8,961.5 |
| EBIT, % | 18.18 | 12.91 | 13.55 | 13.2 | 12.66 | 14.1 | 14.1 | 14.1 | 14.1 | 14.1 |
| Total Cash | 17,963.7 | 20,056.8 | 23,854.0 | 28,224.0 | 32,912.0 | 31,363.4 | 34,090.4 | 37,054.4 | 40,276.2 | 43,778.1 |
| Total Cash, percent | .0 | .0 | .0 | .0 | .0 | .0 | .0 | .0 | .0 | .0 |
| Account Receivables | 14,850.7 | 13,706.3 | 14,306.0 | 14,566.0 | 10,710.0 | 18,055.8 | 19,625.7 | 21,332.1 | 23,186.8 | 25,202.8 |
| Account Receivables, % | 48.81 | 46.49 | 41.5 | 35.89 | 25.56 | 39.65 | 39.65 | 39.65 | 39.65 | 39.65 |
| Inventories | 954.1 | 986.1 | 1,646.5 | 1,591.0 | 2,372.0 | 1,897.9 | 2,062.9 | 2,242.3 | 2,437.2 | 2,649.1 |
| Inventories, % | 3.14 | 3.34 | 4.78 | 3.92 | 5.66 | 4.17 | 4.17 | 4.17 | 4.17 | 4.17 |
| Accounts Payable | 9,450.8 | 7,224.4 | 7,247.0 | 7,613.0 | 8,563.0 | 10,545.1 | 11,462.0 | 12,458.6 | 13,541.8 | 14,719.2 |
| Accounts Payable, % | 31.06 | 24.5 | 21.02 | 18.76 | 20.44 | 23.16 | 23.16 | 23.16 | 23.16 | 23.16 |
| Capital Expenditure | -485.4 | -126.5 | -280.3 | -320.0 | -276.0 | -390.2 | -424.2 | -461.0 | -501.1 | -544.7 |
| Capital Expenditure, % | -1.6 | -0.42906 | -0.81303 | -0.78853 | -0.65877 | -0.85693 | -0.85693 | -0.85693 | -0.85693 | -0.85693 |
| Tax Rate, % | 25.79 | 25.79 | 25.79 | 25.79 | 25.79 | 25.79 | 25.79 | 25.79 | 25.79 | 25.79 |
| EBITAT | 4,116.8 | 2,821.8 | 3,459.3 | 3,979.8 | 3,934.4 | 4,765.3 | 5,179.6 | 5,630.0 | 6,119.5 | 6,651.6 |
| Depreciation | ||||||||||
| Changes in Account Receivables | ||||||||||
| Changes in Inventories | ||||||||||
| Changes in Accounts Payable | ||||||||||
| Capital Expenditure | ||||||||||
| UFCF | -2,452.3 | 1,898.4 | 2,269.5 | 4,183.3 | 8,039.4 | -90.3 | 4,398.5 | 4,780.9 | 5,196.6 | 5,648.4 |
| WACC, % | 5.26 | 5.26 | 5.26 | 5.26 | 5.26 | 5.26 | 5.26 | 5.26 | 5.26 | 5.26 |
| PV UFCF | ||||||||||
| SUM PV UFCF | 16,589.6 | |||||||||
| Long Term Growth Rate, % | 4.00 | |||||||||
| Free cash flow (T + 1) | 5,874 | |||||||||
| Terminal Value | 467,354 | |||||||||
| Present Terminal Value | 361,737 | |||||||||
| Enterprise Value | 378,326 | |||||||||
| Net Debt | -31,903 | |||||||||
| Equity Value | 410,229 | |||||||||
| Diluted Shares Outstanding, MM | 9 | |||||||||
| Equity Value Per Share | 46,395.52 |
What You'll Receive
- Adjustable Forecast Inputs: Seamlessly modify assumptions such as growth rate, profit margins, and WACC to develop various scenarios.
- Real-World Data: Honeywell Automation India Limited’s (HONAUTNS) financial data is pre-populated to facilitate your analysis.
- Automatic DCF Outputs: The template provides automatic calculations for Net Present Value (NPV) and intrinsic value.
- Customizable and Professional Design: A sophisticated Excel model tailored to meet your valuation requirements.
- Designed for Analysts and Investors: Perfect for testing projections, validating strategies, and enhancing efficiency.
Key Features
- Comprehensive DCF Calculator: Features both unlevered and levered DCF valuation models tailored for Honeywell Automation India Limited (HONAUTNS).
- WACC Calculator: Pre-configured Weighted Average Cost of Capital sheet with customizable parameters specific to HONAUTNS.
- Customizable Forecast Assumptions: Adjust growth rates, capital expenses, and discount rates to fit HONAUTNS's financial strategies.
- Integrated Financial Ratios: Evaluate profitability, leverage, and efficiency metrics for Honeywell Automation India Limited (HONAUTNS).
- Interactive Dashboard and Charts: Visual representations highlight essential valuation indicators for straightforward analysis.
How It Functions
- Step 1: Download the Excel spreadsheet.
- Step 2: Examine Honeywell Automation India Limited’s pre-filled financial data and projections.
- Step 3: Adjust key inputs such as revenue growth, WACC, and tax rates (highlighted cells).
- Step 4: Observe the DCF model update in real-time as you modify your assumptions.
- Step 5: Evaluate the outputs and apply the results to inform your investment choices.
Why Choose This Calculator for Honeywell Automation India Limited (HONAUTNS)?
- All-in-One Solution: Incorporates DCF, WACC, and a variety of financial ratio analyses in a single tool.
- Flexible Input Options: Modify the yellow-highlighted cells to explore different scenarios.
- In-Depth Analysis: Automatically computes the intrinsic value and Net Present Value for Honeywell Automation India Limited (HONAUTNS).
- Preloaded Information: Historical and projected data provide reliable starting points for analysis.
- High-Quality Standards: Perfect for financial analysts, investors, and business consultants specializing in Honeywell Automation India Limited (HONAUTNS).
Who Can Benefit from This Product?
- Professional Investors: Create comprehensive and accurate valuation models for analyzing portfolios related to Honeywell Automation India Limited (HONAUTNS).
- Corporate Finance Teams: Evaluate valuation scenarios to inform and shape internal strategic decisions.
- Consultants and Advisors: Deliver precise valuation insights to clients focused on Honeywell Automation India Limited (HONAUTNS).
- Students and Educators: Apply real-world data for practical learning and teaching in financial modeling.
- Tech Enthusiasts: Gain insights into how technology companies like Honeywell Automation India Limited (HONAUTNS) are valued in the marketplace.
What the Template Includes
- Pre-Filled Data: Contains Honeywell Automation India Limited’s historical financials and projections.
- Discounted Cash Flow Model: Editable DCF valuation model with automatic calculations for ease of use.
- Weighted Average Cost of Capital (WACC): A specific sheet for calculating WACC using tailored inputs.
- Key Financial Ratios: Evaluate Honeywell’s profitability, efficiency, and financial leverage.
- Customizable Inputs: Easily modify revenue growth rates, profit margins, and tax percentages.
- Clear Dashboard: Visual representations including charts and tables summarizing essential valuation outcomes.
Disclaimer
All information, articles, and product details provided on this website are for general informational and educational purposes only. We do not claim any ownership over, nor do we intend to infringe upon, any trademarks, copyrights, logos, brand names, or other intellectual property mentioned or depicted on this site. Such intellectual property remains the property of its respective owners, and any references here are made solely for identification or informational purposes, without implying any affiliation, endorsement, or partnership.
We make no representations or warranties, express or implied, regarding the accuracy, completeness, or suitability of any content or products presented. Nothing on this website should be construed as legal, tax, investment, financial, medical, or other professional advice. In addition, no part of this site—including articles or product references—constitutes a solicitation, recommendation, endorsement, advertisement, or offer to buy or sell any securities, franchises, or other financial instruments, particularly in jurisdictions where such activity would be unlawful.
All content is of a general nature and may not address the specific circumstances of any individual or entity. It is not a substitute for professional advice or services. Any actions you take based on the information provided here are strictly at your own risk. You accept full responsibility for any decisions or outcomes arising from your use of this website and agree to release us from any liability in connection with your use of, or reliance upon, the content or products found herein.