
|
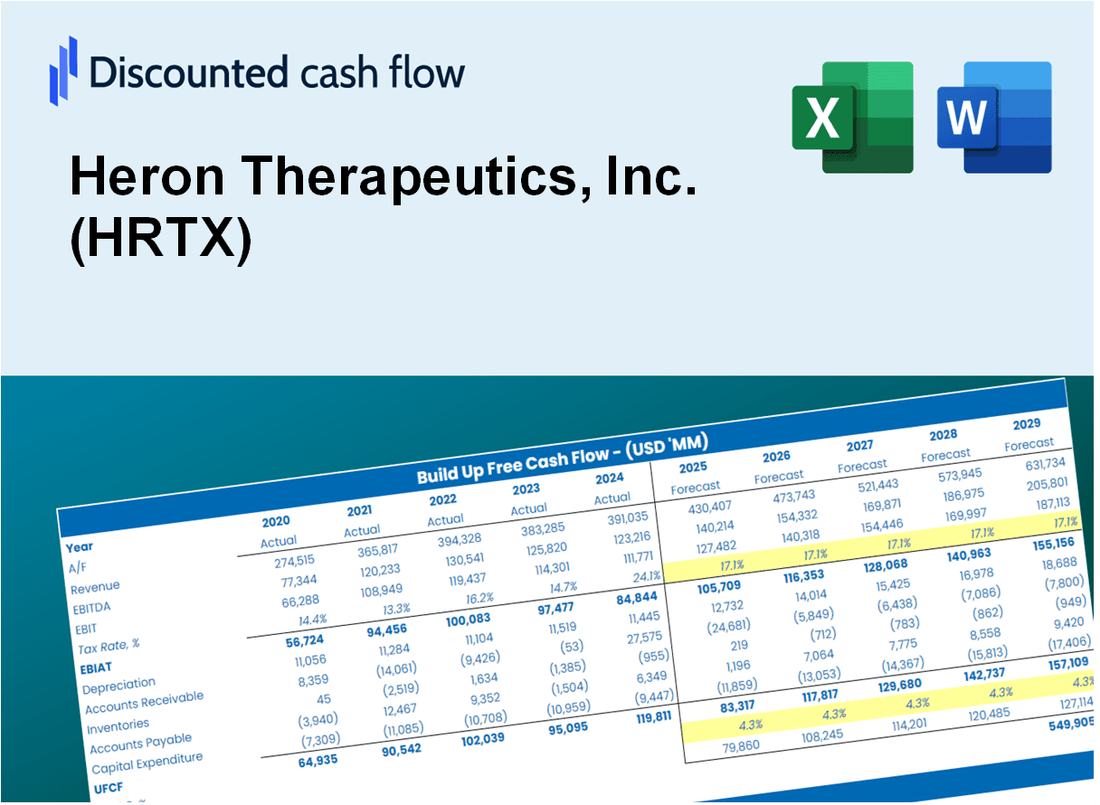
Valoración DCF de Heron Therapeutics, Inc. (HRTX) |
Completamente Editable: Adáptelo A Sus Necesidades En Excel O Sheets
Diseño Profesional: Plantillas Confiables Y Estándares De La Industria
Predeterminadas Para Un Uso Rápido Y Eficiente
Compatible con MAC / PC, completamente desbloqueado
No Se Necesita Experiencia; Fáciles De Seguir
Heron Therapeutics, Inc. (HRTX) Bundle
¡Explore las perspectivas financieras de Heron Therapeutics, Inc. (HRTX) con nuestra calculadora DCF fácil de usar! Ingrese sus proyecciones para el crecimiento, los márgenes de beneficio y los gastos para calcular el valor intrínseco de Heron Therapeutics, Inc. (HRTX) y refinar su enfoque de inversión.
Discounted Cash Flow (DCF) - (USD MM)
| Year | AY1 2020 |
AY2 2021 |
AY3 2022 |
AY4 2023 |
AY5 2024 |
FY1 2025 |
FY2 2026 |
FY3 2027 |
FY4 2028 |
FY5 2029 |
|---|---|---|---|---|---|---|---|---|---|---|
| Revenue | 88.6 | 86.3 | 107.7 | 127.0 | 144.3 | 163.6 | 185.6 | 210.5 | 238.8 | 270.8 |
| Revenue Growth, % | 0 | -2.59 | 24.7 | 17.99 | 13.57 | 13.42 | 13.42 | 13.42 | 13.42 | 13.42 |
| EBITDA | -222.5 | -215.3 | -176.7 | -103.8 | -5.1 | -126.1 | -143.0 | -162.2 | -183.9 | -208.6 |
| EBITDA, % | -251.05 | -249.29 | -164.07 | -81.7 | -3.5 | -77.04 | -77.04 | -77.04 | -77.04 | -77.04 |
| Depreciation | 2.8 | 3.0 | 2.9 | 2.9 | 2.5 | 4.4 | 5.0 | 5.6 | 6.4 | 7.3 |
| Depreciation, % | 3.21 | 3.5 | 2.68 | 2.28 | 1.73 | 2.68 | 2.68 | 2.68 | 2.68 | 2.68 |
| EBIT | -225.4 | -218.3 | -179.6 | -106.7 | -7.5 | -127.4 | -144.5 | -163.9 | -185.9 | -210.8 |
| EBIT, % | -254.27 | -252.79 | -166.76 | -83.98 | -5.23 | -77.84 | -77.84 | -77.84 | -77.84 | -77.84 |
| Total Cash | 208.5 | 157.6 | 84.9 | 80.4 | 59.3 | 125.4 | 142.2 | 161.3 | 183.0 | 207.5 |
| Total Cash, percent | .0 | .0 | .0 | .0 | .0 | .0 | .0 | .0 | .0 | .0 |
| Account Receivables | 41.9 | 35.5 | 52.0 | 60.1 | 78.9 | 78.1 | 88.6 | 100.5 | 114.0 | 129.3 |
| Account Receivables, % | 47.21 | 41.11 | 48.34 | 47.34 | 54.67 | 47.73 | 47.73 | 47.73 | 47.73 | 47.73 |
| Inventories | 41.9 | 48.4 | 54.6 | 42.1 | 53.2 | 73.3 | 83.1 | 94.3 | 107.0 | 121.3 |
| Inventories, % | 47.28 | 56.03 | 50.68 | 33.15 | 36.84 | 44.8 | 44.8 | 44.8 | 44.8 | 44.8 |
| Accounts Payable | .6 | 3.9 | 3.6 | 3.8 | 11.7 | 6.4 | 7.3 | 8.3 | 9.4 | 10.6 |
| Accounts Payable, % | 0.70963 | 4.49 | 3.33 | 2.99 | 8.12 | 3.93 | 3.93 | 3.93 | 3.93 | 3.93 |
| Capital Expenditure | -6.8 | -3.0 | -1.8 | -1.5 | -1.7 | -5.0 | -5.7 | -6.4 | -7.3 | -8.3 |
| Capital Expenditure, % | -7.69 | -3.5 | -1.69 | -1.22 | -1.18 | -3.06 | -3.06 | -3.06 | -3.06 | -3.06 |
| Tax Rate, % | 0 | 0 | 0 | 0 | 0 | 0 | 0 | 0 | 0 | 0 |
| EBITAT | -225.4 | -218.3 | -179.6 | -106.7 | -7.5 | -127.4 | -144.5 | -163.9 | -185.9 | -210.8 |
| Depreciation | ||||||||||
| Changes in Account Receivables | ||||||||||
| Changes in Inventories | ||||||||||
| Changes in Accounts Payable | ||||||||||
| Capital Expenditure | ||||||||||
| UFCF | -312.5 | -215.2 | -201.5 | -100.8 | -28.6 | -152.7 | -164.6 | -186.7 | -211.8 | -240.2 |
| WACC, % | 6.82 | 6.82 | 6.82 | 6.82 | 6.82 | 6.82 | 6.82 | 6.82 | 6.82 | 6.82 |
| PV UFCF | ||||||||||
| SUM PV UFCF | -775.7 | |||||||||
| Long Term Growth Rate, % | 2.00 | |||||||||
| Free cash flow (T + 1) | -245 | |||||||||
| Terminal Value | -5,081 | |||||||||
| Present Terminal Value | -3,653 | |||||||||
| Enterprise Value | -4,429 | |||||||||
| Net Debt | 152 | |||||||||
| Equity Value | -4,581 | |||||||||
| Diluted Shares Outstanding, MM | 152 | |||||||||
| Equity Value Per Share | -30.05 |
What You Will Get
- Real HRTX Financials: Access to historical and projected data for precise valuation.
- Customizable Inputs: Adjust WACC, tax rates, revenue growth, and capital expenditures as needed.
- Dynamic Calculations: Intrinsic value and NPV are computed automatically.
- Scenario Analysis: Evaluate various scenarios to assess Heron Therapeutics' future performance.
- User-Friendly Design: Designed for professionals while remaining approachable for newcomers.
Key Features
- Comprehensive HRTX Data: Pre-loaded with Heron Therapeutics' historical performance metrics and future growth forecasts.
- Customizable Assumptions: Modify key factors such as revenue projections, profit margins, discount rates, tax implications, and capital investments.
- Interactive Valuation Framework: Instant recalculations of Net Present Value (NPV) and intrinsic value based on your customized parameters.
- What-If Analysis: Develop various forecasting scenarios to evaluate a range of valuation possibilities.
- Intuitive User Interface: Designed for ease of use, catering to both industry experts and novices.
How It Works
- Download: Obtain the pre-built Excel file containing Heron Therapeutics, Inc.'s (HRTX) financial data.
- Customize: Modify projections, such as revenue growth, EBITDA %, and WACC to fit your analysis.
- Update Automatically: The intrinsic value and NPV calculations refresh in real-time as data changes.
- Test Scenarios: Generate various forecasts and instantly compare different outcomes.
- Make Decisions: Leverage the valuation insights to inform your investment approach.
Why Choose This Calculator for Heron Therapeutics, Inc. (HRTX)?
- Designed for Healthcare Experts: A sophisticated tool tailored for analysts, biopharma executives, and consultants.
- Comprehensive Data: Heron Therapeutics’ historical and projected financials are preloaded for precision.
- Flexible Scenario Analysis: Effortlessly test various forecasts and assumptions.
- Insightful Outputs: Automatically computes intrinsic value, NPV, and essential metrics.
- User-Friendly: Step-by-step guidance simplifies the entire process.
Who Should Use This Product?
- Individual Investors: Make informed decisions about buying or selling Heron Therapeutics stock (HRTX).
- Financial Analysts: Streamline valuation processes with ready-to-use financial models for Heron Therapeutics (HRTX).
- Consultants: Deliver professional valuation insights on Heron Therapeutics (HRTX) to clients quickly and accurately.
- Business Owners: Understand how biopharmaceutical companies like Heron Therapeutics (HRTX) are valued to guide your own strategy.
- Finance Students: Learn valuation techniques using real-world data and scenarios related to Heron Therapeutics (HRTX).
What the Template Contains
- Comprehensive DCF Model: Editable template featuring detailed valuation calculations tailored for Heron Therapeutics, Inc. (HRTX).
- Real-World Data: Heron Therapeutics’ historical and projected financials preloaded for in-depth analysis.
- Customizable Parameters: Adjust WACC, growth rates, and tax assumptions to explore various scenarios.
- Financial Statements: Complete annual and quarterly breakdowns for enhanced insights into performance.
- Key Ratios: Integrated analysis for profitability, efficiency, and leverage specific to Heron Therapeutics, Inc. (HRTX).
- Dashboard with Visual Outputs: Charts and tables designed to present clear, actionable results.
Disclaimer
All information, articles, and product details provided on this website are for general informational and educational purposes only. We do not claim any ownership over, nor do we intend to infringe upon, any trademarks, copyrights, logos, brand names, or other intellectual property mentioned or depicted on this site. Such intellectual property remains the property of its respective owners, and any references here are made solely for identification or informational purposes, without implying any affiliation, endorsement, or partnership.
We make no representations or warranties, express or implied, regarding the accuracy, completeness, or suitability of any content or products presented. Nothing on this website should be construed as legal, tax, investment, financial, medical, or other professional advice. In addition, no part of this site—including articles or product references—constitutes a solicitation, recommendation, endorsement, advertisement, or offer to buy or sell any securities, franchises, or other financial instruments, particularly in jurisdictions where such activity would be unlawful.
All content is of a general nature and may not address the specific circumstances of any individual or entity. It is not a substitute for professional advice or services. Any actions you take based on the information provided here are strictly at your own risk. You accept full responsibility for any decisions or outcomes arising from your use of this website and agree to release us from any liability in connection with your use of, or reliance upon, the content or products found herein.