
|
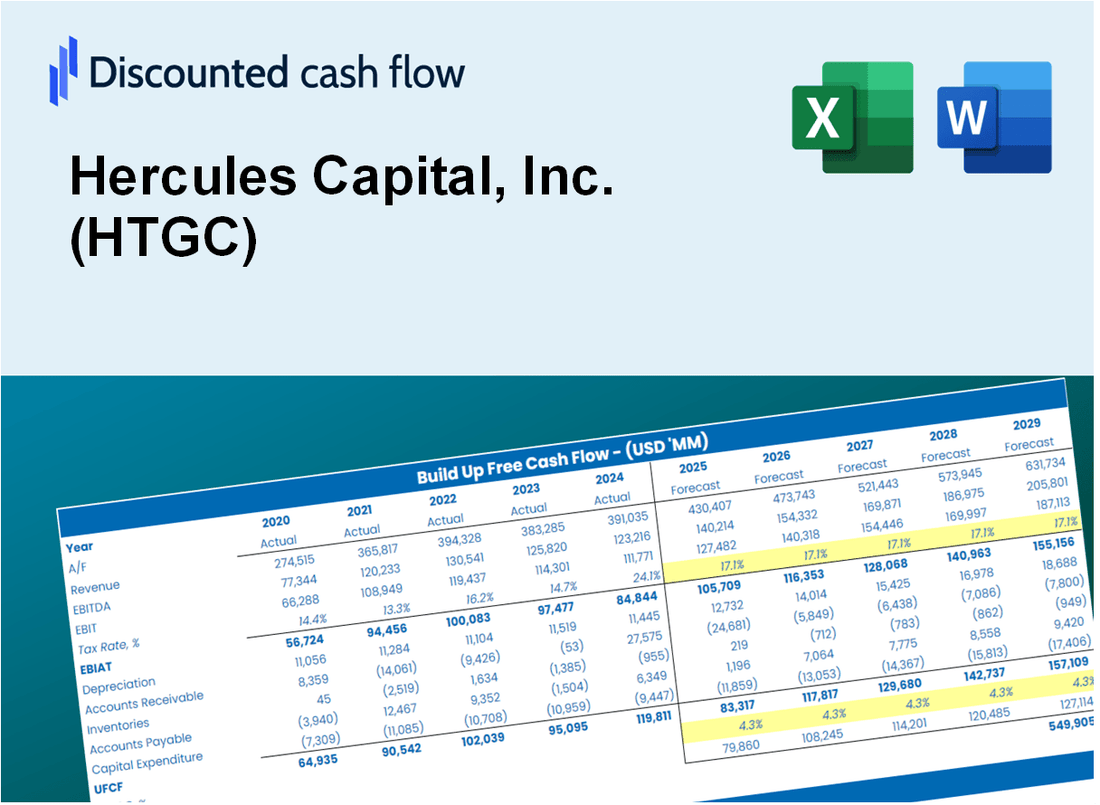
Valoración DCF de Hercules Capital, Inc. (HTGC) |
Completamente Editable: Adáptelo A Sus Necesidades En Excel O Sheets
Diseño Profesional: Plantillas Confiables Y Estándares De La Industria
Predeterminadas Para Un Uso Rápido Y Eficiente
Compatible con MAC / PC, completamente desbloqueado
No Se Necesita Experiencia; Fáciles De Seguir
Hercules Capital, Inc. (HTGC) Bundle
¡Simplifique la valoración de Hercules Capital, Inc. (HTGC) con esta calculadora DCF personalizable! Con Real Hercules Capital, Inc. (HTGC) financieras y entradas de pronóstico ajustables, puede probar escenarios y descubrir el valor razonable de Hercules Capital, Inc. (HTGC) en minutos.
What You Will Get
- Real Hercules Capital Data: Preloaded financials – from revenue to EBIT – based on actual and projected figures for Hercules Capital, Inc. (HTGC).
- Full Customization: Adjust all critical parameters (yellow cells) like WACC, growth %, and tax rates specific to Hercules Capital, Inc. (HTGC).
- Instant Valuation Updates: Automatic recalculations to analyze the impact of changes on Hercules Capital, Inc.’s (HTGC) fair value.
- Versatile Excel Template: Tailored for quick edits, scenario testing, and detailed projections for Hercules Capital, Inc. (HTGC).
- Time-Saving and Accurate: Skip building models from scratch while maintaining precision and flexibility for Hercules Capital, Inc. (HTGC).
Key Features
- Comprehensive Financial Data: Hercules Capital’s historical financial statements and pre-filled projections.
- Customizable Parameters: Adjust WACC, tax rates, revenue growth, and EBITDA margins to fit your analysis.
- Real-Time Valuation: Watch Hercules Capital’s intrinsic value update instantly.
- Intuitive Visualizations: Dashboard charts present valuation outcomes and essential metrics clearly.
- Designed for Precision: A professional-grade tool tailored for analysts, investors, and finance professionals.
How It Works
- Download: Obtain the pre-configured Excel file containing Hercules Capital, Inc.'s (HTGC) financial data.
- Customize: Modify forecasts such as revenue growth, EBITDA %, and WACC to suit your analysis.
- Update Automatically: Watch as the intrinsic value and NPV calculations refresh in real-time.
- Test Scenarios: Generate various projections and instantly compare the results.
- Make Decisions: Leverage the valuation outcomes to inform your investment choices.
Why Choose Hercules Capital, Inc. (HTGC)?
- Streamlined Process: Quickly access funding solutions without the hassle of lengthy applications.
- Enhanced Financial Insight: Our expert analysis helps minimize risks and maximize returns.
- Tailored Solutions: Customize your financing options to meet your unique business needs.
- Transparent Communication: Clear reporting and updates keep you informed every step of the way.
- Preferred by Industry Leaders: Our reputation for excellence makes us the go-to choice for professionals.
Who Should Use This Product?
- Individual Investors: Make informed decisions about buying or selling Hercules Capital, Inc. (HTGC) stock.
- Financial Analysts: Streamline valuation processes with ready-to-use financial models tailored for Hercules Capital, Inc. (HTGC).
- Consultants: Deliver professional valuation insights regarding Hercules Capital, Inc. (HTGC) to clients quickly and accurately.
- Business Owners: Understand how companies like Hercules Capital, Inc. (HTGC) are valued to guide your own investment strategy.
- Finance Students: Learn valuation techniques using real-world data and scenarios related to Hercules Capital, Inc. (HTGC).
What the Template Contains
- Comprehensive DCF Model: Editable template with detailed valuation calculations tailored for Hercules Capital, Inc. (HTGC).
- Real-World Data: Hercules Capital’s historical and projected financials preloaded for analysis.
- Customizable Parameters: Adjust WACC, growth rates, and tax assumptions to test various scenarios.
- Financial Statements: Full annual and quarterly breakdowns for deeper insights into Hercules Capital's performance.
- Key Ratios: Built-in analysis for profitability, efficiency, and leverage specific to Hercules Capital, Inc. (HTGC).
- Dashboard with Visual Outputs: Charts and tables for clear, actionable results regarding Hercules Capital, Inc. (HTGC).
Disclaimer
All information, articles, and product details provided on this website are for general informational and educational purposes only. We do not claim any ownership over, nor do we intend to infringe upon, any trademarks, copyrights, logos, brand names, or other intellectual property mentioned or depicted on this site. Such intellectual property remains the property of its respective owners, and any references here are made solely for identification or informational purposes, without implying any affiliation, endorsement, or partnership.
We make no representations or warranties, express or implied, regarding the accuracy, completeness, or suitability of any content or products presented. Nothing on this website should be construed as legal, tax, investment, financial, medical, or other professional advice. In addition, no part of this site—including articles or product references—constitutes a solicitation, recommendation, endorsement, advertisement, or offer to buy or sell any securities, franchises, or other financial instruments, particularly in jurisdictions where such activity would be unlawful.
All content is of a general nature and may not address the specific circumstances of any individual or entity. It is not a substitute for professional advice or services. Any actions you take based on the information provided here are strictly at your own risk. You accept full responsibility for any decisions or outcomes arising from your use of this website and agree to release us from any liability in connection with your use of, or reliance upon, the content or products found herein.