
|
Hubbell Incorporated (HUBB): Análisis de 5 Fuerzas [Actualizado en Ene-2025] |
Completamente Editable: Adáptelo A Sus Necesidades En Excel O Sheets
Diseño Profesional: Plantillas Confiables Y Estándares De La Industria
Predeterminadas Para Un Uso Rápido Y Eficiente
Compatible con MAC / PC, completamente desbloqueado
No Se Necesita Experiencia; Fáciles De Seguir
Hubbell Incorporated (HUBB) Bundle
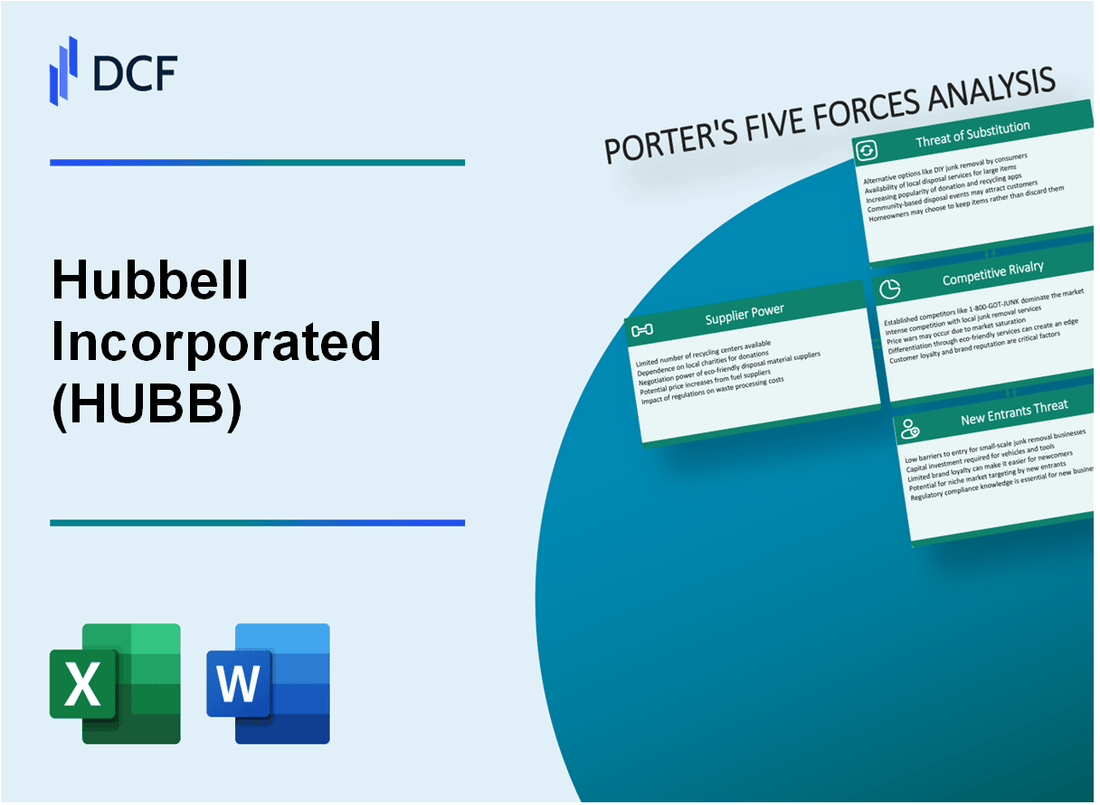
En el panorama dinámico de la infraestructura eléctrica y los componentes industriales, Hubbell Incorporated se encuentra en la encrucijada de innovación, competencia y posicionamiento estratégico del mercado. Al diseccionar el marco de las cinco fuerzas de Michael Porter, revelamos la intrincada dinámica que dan forma a la estrategia competitiva de Hubbell en 2024, desde navegar las relaciones complejas de proveedores hasta enfrentar las interrupciones tecnológicas y la gestión de intensas rivalidades del mercado. Este análisis ofrece una visión integral de los desafíos estratégicos y las oportunidades que definen la resiliencia del mercado de Hubbell y el potencial de un crecimiento sostenido en un ecosistema de equipos eléctricos cada vez más sofisticados.
Hubbell Incorporated (Hubb) - Las cinco fuerzas de Porter: poder de negociación de los proveedores
Fabricantes de componentes eléctricos e industriales especializados
A partir de 2024, Hubbell Incorporated identifica aproximadamente 7-12 proveedores críticos en fabricación especializada de componentes eléctricos e industriales. Estos proveedores tienen capacidades únicas en la producción de componentes eléctricos de alta precisión.
| Categoría de proveedor | Número de proveedores clave | Duración promedio del contrato de suministro |
|---|---|---|
| Componentes eléctricos | 5 | 4-5 años |
| Proveedores de metales crudos | 3-4 | 3-4 años |
| Materiales industriales especializados | 2-3 | 3-5 años |
Cambiar los costos y la complejidad de los componentes
Hubbell encuentra altos costos de conmutación estimados entre $ 250,000 y $ 750,000 para componentes eléctricos complejos y personalizados. Estos costos incluyen:
- Rediseño de gastos de ingeniería
- Procesos de recertificación
- Posibles interrupciones de producción
- Vetrainización de líneas de fabricación
Contratos estratégicos de proveedores a largo plazo
Hubbell mantiene contratos estratégicos que reducen el apalancamiento de la negociación de proveedores, con aproximadamente el 65-75% de los proveedores de componentes críticos bloqueados en acuerdos de varios años.
| Tipo de contrato | Porcentaje de proveedores | Valor de contrato promedio |
|---|---|---|
| Precio fijo a largo plazo | 45% | $ 2.3-3.5 millones |
| Precios basados en volumen | 30% | $ 1.7-2.9 millones |
| Contratos vinculados a rendimiento | 25% | $ 1.2-2.1 millones |
Proveedores de materia prima clave
Los proveedores clave de materias primas de Hubbell incluyen fabricantes especializados de cobre, aluminio y polímeros avanzados utilizados en componentes eléctricos.
- Proveedores de cobre: 3 proveedores principales
- Proveedores de aluminio: 2-3 socios estratégicos
- Fabricantes de polímeros avanzados: 2 proveedores especializados
Hubbell Incorporated (HUBB) - Las cinco fuerzas de Porter: poder de negociación de los clientes
Desglose del segmento de clientes
| Sector | Porcentaje de ingresos | Tipos de clientes clave |
|---|---|---|
| Utilidades eléctricos | 42% | Grandes compañías de distribución de energía |
| Industrial | 33% | Instalaciones de fabricación |
| Construcción comercial | 25% | Empresas de construcción, contratistas |
Análisis de energía de compra de clientes
Los 10 principales clientes de Hubbell representan el 37% de los ingresos anuales totales de $ 5.2 mil millones en 2023. Las principales compañías de servicios públicos como Duke Energy, Southern Company y American Electric Power tienen un importante apalancamiento de negociación.
Métricas de concentración del mercado
- Concentración del cliente del sector de servicios públicos: 4 clientes principales controlan el 22% de las compras de infraestructura eléctrica
- Valor promedio del contrato para clientes de grandes servicios públicos: $ 18.5 millones anuales
- Costo de cambio de cliente: estimado $ 2.3 millones por transición de infraestructura
Indicadores de sensibilidad al precio
Elasticidad de precio en el mercado de infraestructura eléctrica: 0.65, que indica una sensibilidad moderada de precios entre los clientes.
Impacto de diferenciación de productos
| Categoría de productos | Características únicas | Tasa de retención de clientes |
|---|---|---|
| Soluciones de cuadrícula inteligente | Integración de IoT, eficiencia energética | 89% |
| Equipo de seguridad eléctrica | Tecnologías de protección avanzada | 92% |
Demanda de eficiencia energética
Inversiones de tecnología verde: El 63% de los clientes priorizan las soluciones eléctricas de eficiencia energética en las decisiones de adquisición.
Hubbell Incorporated (Hubb) - Las cinco fuerzas de Porter: rivalidad competitiva
Panorama competitivo Overview
A partir de 2024, Hubbell Incorporated enfrenta una importante rivalidad competitiva en el sector de fabricación de equipos eléctricos.
| Competidor | Cuota de mercado | Ingresos (2023) |
|---|---|---|
| Eaton Corporation | 18.5% | $ 22.6 mil millones |
| Schneider Electric | 16.3% | $ 34.2 mil millones |
| ABB LTD | 14.7% | $ 28.9 mil millones |
| Hubbell Incorporated | 8.2% | $ 5.1 mil millones |
Estrategias competitivas
El posicionamiento competitivo de Hubbell implica la diferenciación estratégica a través de la innovación tecnológica.
- Inversión de I + D: $ 237 millones en 2023
- Solicitudes de patentes: 42 nuevas patentes de equipos eléctricos
- Ciclo de desarrollo de productos: 18-24 meses
Dinámica del mercado
El mercado de equipos eléctricos demuestra una intensa competencia con múltiples jugadores mundiales.
| Factor competitivo | Nivel de intensidad |
|---|---|
| Competencia de precios | Alto |
| Innovación tecnológica | Muy alto |
| Diferenciación de productos | Moderado |
Métricas de rendimiento
Los indicadores de rendimiento competitivos de Hubbell destacan los desafíos del mercado.
- Tasa de penetración del mercado: 12.4%
- Margen bruto: 34.6%
- Margen operativo: 15.2%
Hubbell Incorporated (Hubb) - Cinco fuerzas de Porter: amenaza de sustitutos
Tecnologías emergentes de redes inteligentes y energía renovable
El tamaño del mercado global de la red inteligente alcanzó los $ 28.68 mil millones en 2022 y se proyecta que crecerá a $ 61.42 mil millones para 2030, con una tasa compuesta anual de 10.05%.
| Tecnología | Penetración del mercado (%) | Tasa de crecimiento anual |
|---|---|---|
| Sistemas solares fotovoltaicos | 12.3% | 8.7% |
| Infraestructura de energía eólica | 7.6% | 9.2% |
| Soluciones de almacenamiento de baterías | 5.4% | 12.5% |
Adopción creciente de soluciones alternativas de infraestructura eléctrica
Las alternativas de energía renovable constituyen el 22.4% del total de la generación de electricidad de EE. UU. En 2022.
- Se espera que el mercado de recursos energéticos distribuidos alcance los $ 64.9 mil millones para 2025
- Instalaciones de microrred que se proyectan para crecer al 24.5% CAGR hasta 2027
- El mercado del sistema de almacenamiento de energía prevista para alcanzar los $ 35.6 mil millones para 2026
Avances tecnológicos en el diseño de componentes eléctricos
Mercado global de componentes eléctricos valorado en $ 397.3 mil millones en 2022.
| Categoría de componentes | Valor de mercado ($ b) | CAGR esperado |
|---|---|---|
| Semiconductores avanzados | 42.6 | 11.3% |
| Sensores inteligentes | 28.9 | 14.2% |
| Electrónica de potencia | 36.5 | 9.7% |
Potencial interrupción de sistemas eléctricos digitales y habilitados para IoT
IoT en el mercado de infraestructura eléctrica estimada en $ 23.5 mil millones en 2023.
- Soluciones eléctricas industriales IoT que crecen a 15.3% anuales
- Se espera que las instalaciones de dispositivos conectados lleguen a 55.7 mil millones para 2025
- Inversiones de ciberseguridad en infraestructura eléctrica proyectada en $ 12.6 mil millones
Hubbell Incorporated (Hubb) - Las cinco fuerzas de Porter: amenaza de nuevos participantes
Requisitos de capital en la fabricación de equipos eléctricos
El sector de fabricación de equipos eléctricos de Hubbell Incorporated requiere una inversión de capital inicial sustancial. A partir de 2023, el capital de inicio promedio para la fabricación de equipos eléctricos oscila entre $ 5.2 millones y $ 8.7 millones.
| Componente de capital | Costo estimado |
|---|---|
| Equipo de fabricación | $ 3.5 millones |
| Investigación y desarrollo | $ 1.2 millones |
| Configuración inicial de la instalación | $ 1.8 millones |
| Capital de explotación | $ 2.2 millones |
Experiencia técnica y conocimiento de ingeniería
Las barreras técnicas en la fabricación de equipos eléctricos son significativas.
- Requisito de grado de ingeniería avanzada: Licenciatura mínima en Ingeniería Eléctrica
- Capacitación especializada: promedio de 3-5 años de experiencia específica de la industria
- Costos de certificación técnica: $ 15,000 a $ 45,000 por profesional
Redes de reputación y distribución de la marca
La posición del mercado de Hubbell requiere una infraestructura de distribución extensa.
| Métrica de red de distribución | El estado actual de Hubbell |
|---|---|
| Centros de distribución totales | 42 en todo el país |
| Gasto anual de distribución | $ 78.3 millones |
| Alcance de distribución promedio | 97% de los mercados eléctricos de EE. UU. |
Certificaciones de la industria y cumplimiento regulatorio
El cumplimiento regulatorio implica inversiones sustanciales.
- Costo de certificación UL: $ 50,000 a $ 250,000
- Cumplimiento estándar de IEEE: $ 75,000 anualmente
- Certificación de seguridad de OSHA: $ 35,000 por instalación
Total de barreras de entrada estimadas: $ 6.5 millones a $ 12.3 millones
Hubbell Incorporated (HUBB) - Porter's Five Forces: Competitive rivalry
Rivalry is definitely intense in the electrical and utility solutions space, you're competing against global giants. We're talking about players like Eaton, Schneider Electric, and Siemens AG, all vying for the same infrastructure spend. This isn't a sleepy market; it's one where scale and technological breadth matter a lot.
To put some numbers on that rivalry, let's look at the revenue scale. Competitors like AMETEK have a larger top line, with their trailing twelve months revenue ending September 30, 2025, at $7.16B versus Hubbell Incorporated's reported $5.6B in Net Sales for the full year 2024. Still, Hubbell Incorporated is holding its own, especially in its strategic niches. For instance, Hubbell Incorporated's focus on 'Products with Impact'-solutions enabling grid modernization, data centers, and renewables-accounted for over $3.7 billion in sales in 2024, which was 12% of their total sales that year. That's a significant portion of the business fighting in the high-value segments.
Competition here isn't just about who can ship the cheapest breaker; it's a multi-front battle. The focus areas for winning business are clearly innovation, price discipline, and, critically, access to distribution channels. Hubbell Incorporated's response to this pressure is a sharp focus on specific, high-growth areas. Their strategy centers on grid modernization and electrification, which management sees as a $1.2 trillion market opportunity through 2030. This focus, bolstered by the 2025 acquisition of Aclara Technologies, is a key differentiator, helping them secure premium pricing for integrated smart grid solutions.
Here's a quick look at how some of the major players stacked up based on their latest reported annual or trailing revenue figures near the end of 2025:
| Company | Latest Reported Revenue Figure | Period/Basis |
| Hubbell Incorporated (HUBB) | $5.6B | FY 2024 Net Sales |
| AMETEK | $7.16B | TTM ending September 30, 2025 |
| Eaton | $24.9B | FY 2024 Sales |
| Schneider Electric | €38,153 million | FY 2024 Revenues |
| Siemens AG | €19.4 billion | Q3 2025 Comparable Revenue |
The intensity of rivalry is also reflected in margin management. Hubbell Incorporated's Gross Margin rebounded to 24.5% in Q1 2025, up from 23% in late 2023, showing that proactive price/cost management is essential to maintain profitability against competitive pressures.
The core competitive battlegrounds for Hubbell Incorporated involve:
- Driving innovation in smart grid components, like those from the Aclara acquisition.
- Maintaining pricing power in specialized areas like data center infrastructure.
- Securing and expanding relationships within utility distribution channels.
- Successfully integrating acquisitions to create end-to-end solution offerings.
- Offsetting input cost headwinds, such as the $10M steel tariff impact noted in Q1 2025.
You see this focus on differentiation in their segment performance; for example, Grid Automation net sales saw a decrease of approximately 18% in Q3 2025, suggesting that segment might be facing sharper price competition or inventory adjustments compared to the more resilient Utility Solutions segment.
Hubbell Incorporated (HUBB) - Porter's Five Forces: Threat of substitutes
You're analyzing Hubbell Incorporated's competitive landscape, and the threat of substitutes is definitely a nuanced area for them. It's not a simple yes or no; it really depends on which part of the business you're looking at. For the highly specialized Utility Solutions side, the barrier to switching is quite high, but in the broader Electrical Solutions market, you see more pressure from alternatives.
The threat of substitutes is low for specialized Utility Solutions because the stakes are incredibly high. When you're dealing with grid infrastructure, safety and regulatory compliance aren't just suggestions; they are mandates. For instance, in Q3 2025, the Utility Solutions segment brought in $944 million in net sales, showing how mission-critical these components are to utilities. While Grid Infrastructure saw strong organic growth of 8% in that quarter, the Grid Automation side saw sales drop by 18%, which might suggest that certain software or project-based solutions in that area face more substitution risk than the physical infrastructure components.
However, you see a higher threat in the Electrical Solutions segment from generic wiring and lighting products. This segment posted net sales of $559 million in Q3 2025, with 8% organic growth driven by datacenters and light industrial. While that growth is solid, these markets often have more readily available, lower-cost, non-proprietary alternatives for standard components. If a customer is just looking for basic conduit or standard fixtures, the price competition from generic substitutes is certainly more intense here than for a specialized transmission connector.
The biggest long-term substitution threat comes from the shift toward new decentralized energy solutions. These systems, which include rooftop solar and microgrids, are directly challenging the need for traditional grid infrastructure components. The Decentralized Energy System market size is estimated to hit $386.95 billion in 2025, growing at a CAGR of 13.8% from 2024. This growth is partly fueled by the fact that distributed systems reduce transmission and distribution losses, which can account for 8-15% of energy loss in older, centralized grids. So, as more energy is generated locally, the demand profile for Hubbell Incorporated's traditional grid components will evolve.
Still, for critical infrastructure, the high cost of failure acts as a powerful deterrent against unproven alternatives. When you're talking about keeping the lights on or ensuring substation integrity, a small upfront saving on a substitute product is dwarfed by the cost of an outage or a safety incident. Hubbell Incorporated's stated vision centers on a 'Reliable, Resilient and Renewable energy infrastructure,' which underscores the premium customers place on proven quality over cheaper, untested substitutes. This is why, despite the rise of alternatives, Hubbell Incorporated's focus on quality helps lock in demand for their core, high-reliability products.
Here's a quick look at some of the recent financial context surrounding Hubbell Incorporated's operations as of late 2025:
| Metric | Value (Q3 2025) | Context/Comparison |
|---|---|---|
| Total Net Sales | $1.50 billion | 4.1% year-over-year growth. |
| Utility Solutions Net Sales | $944 million | 1% increase year-over-year. |
| Electrical Solutions Net Sales | $559 million | 10% increase year-over-year. |
| Grid Automation Sales Change | -18% | Indicates substitution or project timing risk in this sub-segment. |
| Decentralized Energy System Market Size (Est.) | $386.95 billion | Estimated market size for 2025. |
| Traditional Grid Energy Loss | 8-15% | Losses reduced by distributed systems. |
| Full-Year Adjusted EPS Guidance (Midpoint) | $18.20 | Raised in Q3 2025. |
The key takeaway here is that substitution risk is segment-dependent; it's a real factor in the commoditized electrical space but less so where regulatory compliance and reliability are paramount, like in the utility transmission business.
Hubbell Incorporated (HUBB) - Porter's Five Forces: Threat of new entrants
You're looking at the barriers to entry for a new competitor trying to muscle in on Hubbell Incorporated's turf. Honestly, the hurdles are substantial, built up over more than a century of focused operation and capital deployment. For a newcomer, the sheer scale of what's required to compete effectively is the first major wall to climb.
High capital investment is required to achieve the manufacturing scale and distribution necessary.
To even approach Hubbell Incorporated's operational footprint, a new entrant needs massive upfront capital expenditure (CapEx). Hubbell itself invested $180 million in capital expenditures in 2024 to drive growth and productivity in its facilities. This is against a backdrop where the broader U.S. manufacturing sector expects its own capital expenditures to increase by 5.2% in 2025. Furthermore, the entire Electrical Equipment Manufacturing industry in the United States is estimated to have a market size of $56.3 billion in 2025. A new player must finance the land, infrastructure, and specialized machinery to compete in a market where Hubbell's 2024 total sales were $5.6 billion. The distribution network alone-spanning 52 manufacturing locations and 9 warehouse sites as of the end of 2024-represents a capital sink that few can match quickly.
The necessary scale is best illustrated by Hubbell Incorporated's segment performance, showing where the capital must be deployed to capture revenue:
| Metric | Hubbell Incorporated Data (2024/2025 Est.) | Industry Context |
|---|---|---|
| 2024 Total Sales | $5.6 billion | Market size estimated at $56.3bn in 2025 |
| Utility Solutions Segment Net Sales (2024) | $3.6 billion (or 63.97% of total revenue) | Driven by utility CAPEX, a market Hubbell has dominated for decades. |
| 2024 Capital Expenditures | $180 million | U.S. manufacturing CapEx expected to rise 5.2% in 2025 |
Entrants face significant barriers from established relationships with utilities and contractors.
Hubbell Incorporated has over 135 years in business, which translates directly into deep, entrenched relationships, especially within the Utility Solutions segment. This segment, which made up 63.97% of total revenue in 2024, relies on trust built over decades with electric utilities. When utilities face high-stakes failures, they default to proven suppliers. Hubbell notes that components are generally replaced on a like-for-like basis to avoid risks associated with unproven companies. New entrants must overcome this inertia, which is reinforced by Hubbell's proven track record and scale to ship with low lead times when utilities cannot afford downtime. For instance, Hubbell's Utility Solutions segment reported net sales of $944 million in the third quarter of 2025.
Hubbell's portfolio of over 70 brands creates a substantial product and brand barrier.
The sheer breadth of Hubbell Incorporated's brand architecture acts as a significant deterrent. Hubbell boasts over 75 renowned brands globally, spanning both its Utility Solutions and Electrical Solutions segments. This portfolio covers everything from high-voltage transmission components to specialized wiring devices. For example, the Electrical Solutions segment markets products under brands like Burndy, Killark, and Kellems, while the Utility segment includes Aclara, Chance, and Ohio Brass. Building this level of brand recognition and market penetration across diverse niches takes decades and massive marketing spend. Also, Hubbell holds around 3,100 active U.S. and foreign patents, creating an intellectual property moat around its offerings.
The brand barrier is evident across their core business units:
- Utility Solutions brands serve the T&D grid infrastructure.
- Electrical Solutions brands cover industrial and commercial wiring.
- The portfolio has been refined through strategic divestitures and acquisitions.
- Hubbell's TowerPak solutions are used in over 50% of new transmission projects.
New entrants must navigate complex product certifications and compliance standards.
The electrical and utility sectors are heavily regulated, meaning new products cannot simply be introduced; they must be certified. Navigating the labyrinth of product certifications and compliance standards-like UL or specific utility approval processes-is a time-consuming and costly endeavor that drains early-stage capital. Hubbell's focus on Product Quality and Safety is a core pillar of its strategy, signaling the high bar for entry. The company's commitment to operational discipline is recognized externally; Hubbell was named one of the 2025 World's Most Ethical Companies. This level of established, verifiable compliance and quality assurance is a non-negotiable prerequisite that new entrants must fund and prove over years before securing major utility contracts.
Disclaimer
All information, articles, and product details provided on this website are for general informational and educational purposes only. We do not claim any ownership over, nor do we intend to infringe upon, any trademarks, copyrights, logos, brand names, or other intellectual property mentioned or depicted on this site. Such intellectual property remains the property of its respective owners, and any references here are made solely for identification or informational purposes, without implying any affiliation, endorsement, or partnership.
We make no representations or warranties, express or implied, regarding the accuracy, completeness, or suitability of any content or products presented. Nothing on this website should be construed as legal, tax, investment, financial, medical, or other professional advice. In addition, no part of this site—including articles or product references—constitutes a solicitation, recommendation, endorsement, advertisement, or offer to buy or sell any securities, franchises, or other financial instruments, particularly in jurisdictions where such activity would be unlawful.
All content is of a general nature and may not address the specific circumstances of any individual or entity. It is not a substitute for professional advice or services. Any actions you take based on the information provided here are strictly at your own risk. You accept full responsibility for any decisions or outcomes arising from your use of this website and agree to release us from any liability in connection with your use of, or reliance upon, the content or products found herein.