
|
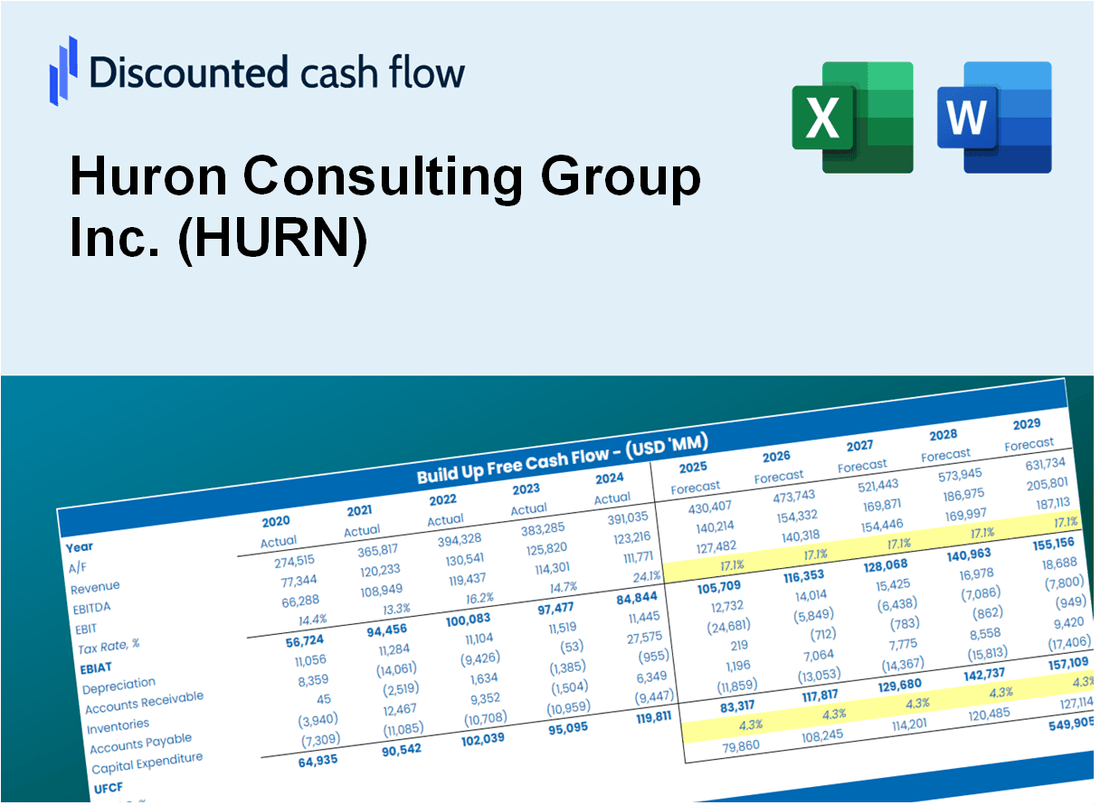
Valoración DCF de Huron Consulting Group Inc. (HURN) |
Completamente Editable: Adáptelo A Sus Necesidades En Excel O Sheets
Diseño Profesional: Plantillas Confiables Y Estándares De La Industria
Predeterminadas Para Un Uso Rápido Y Eficiente
Compatible con MAC / PC, completamente desbloqueado
No Se Necesita Experiencia; Fáciles De Seguir
Huron Consulting Group Inc. (HURN) Bundle
¡Evalúe las perspectivas financieras de Huron Consulting Group Inc. (Hurn) como un experto! Esta calculadora DCF (HURN) proporciona datos financieros previamente llenos junto con la flexibilidad para modificar el crecimiento de los ingresos, WACC, los márgenes y otros supuestos esenciales para alinearse con sus proyecciones.
What You Will Receive
- Customizable Excel Template: A fully adaptable Excel-based DCF Calculator featuring pre-loaded financial data for Huron Consulting Group Inc. (HURN).
- Accurate Data: Access to historical figures and projected estimates (highlighted in the yellow cells).
- Adjustable Forecasts: Modify key assumptions such as revenue growth, EBITDA margin, and WACC.
- Instant Calculations: Quickly observe how your inputs affect Huron’s valuation.
- Professional Resource: Designed for investors, CFOs, consultants, and financial analysts.
- Intuitive Layout: Organized for simplicity and ease of navigation, complete with step-by-step guidance.
Key Features
- Customizable Financial Metrics: Adjust essential inputs such as project costs, revenue projections, and operating margins.
- Instant DCF Valuation: Provides real-time calculations for intrinsic value, NPV, and other financial metrics.
- High-Precision Accuracy: Leverages Huron Consulting Group's actual financial data for dependable valuation results.
- Simplified Scenario Testing: Easily evaluate various assumptions and assess their impacts on outcomes.
- Efficiency Booster: Streamlines the valuation process, removing the necessity to construct intricate models from the ground up.
How It Works
- Step 1: Download the Excel file.
- Step 2: Review pre-entered Huron Consulting Group Inc. (HURN) data (historical and projected).
- Step 3: Adjust key assumptions (yellow cells) based on your analysis.
- Step 4: View automatic recalculations for Huron Consulting Group Inc. (HURN)’s intrinsic value.
- Step 5: Use the outputs for investment decisions or reporting.
Why Choose This Calculator?
- Accurate Data: Up-to-date Huron Consulting Group Inc. (HURN) financials ensure reliable valuation results.
- Customizable: Tailor key parameters such as growth rates, WACC, and tax rates to align with your forecasts.
- Time-Saving: Pre-configured calculations save you the hassle of starting from scratch.
- Professional-Grade Tool: Crafted for investors, analysts, and consultants in the consulting sector.
- User-Friendly: Easy-to-navigate layout and clear instructions make it accessible for all users.
Who Should Use This Product?
- Investors: Accurately assess Huron Consulting Group Inc.’s (HURN) fair value prior to making investment choices.
- CFOs: Utilize a professional-grade DCF model for comprehensive financial reporting and analysis.
- Consultants: Efficiently customize the template for valuation reports tailored to clients.
- Entrepreneurs: Acquire insights into financial modeling practices employed by leading consulting firms.
- Educators: Implement it as a teaching resource to illustrate various valuation methodologies.
What the Template Contains
- Preloaded HURN Data: Historical and projected financial data, including revenue, EBIT, and capital expenditures.
- DCF and WACC Models: Professional-grade sheets for calculating intrinsic value and Weighted Average Cost of Capital.
- Editable Inputs: Yellow-highlighted cells for adjusting revenue growth, tax rates, and discount rates.
- Financial Statements: Comprehensive annual and quarterly financials for deeper analysis.
- Key Ratios: Profitability, leverage, and efficiency ratios to evaluate performance.
- Dashboard and Charts: Visual summaries of valuation outcomes and assumptions.
Disclaimer
All information, articles, and product details provided on this website are for general informational and educational purposes only. We do not claim any ownership over, nor do we intend to infringe upon, any trademarks, copyrights, logos, brand names, or other intellectual property mentioned or depicted on this site. Such intellectual property remains the property of its respective owners, and any references here are made solely for identification or informational purposes, without implying any affiliation, endorsement, or partnership.
We make no representations or warranties, express or implied, regarding the accuracy, completeness, or suitability of any content or products presented. Nothing on this website should be construed as legal, tax, investment, financial, medical, or other professional advice. In addition, no part of this site—including articles or product references—constitutes a solicitation, recommendation, endorsement, advertisement, or offer to buy or sell any securities, franchises, or other financial instruments, particularly in jurisdictions where such activity would be unlawful.
All content is of a general nature and may not address the specific circumstances of any individual or entity. It is not a substitute for professional advice or services. Any actions you take based on the information provided here are strictly at your own risk. You accept full responsibility for any decisions or outcomes arising from your use of this website and agree to release us from any liability in connection with your use of, or reliance upon, the content or products found herein.