
|
iBio, Inc. (IBIO) Valoración DCF |
Completamente Editable: Adáptelo A Sus Necesidades En Excel O Sheets
Diseño Profesional: Plantillas Confiables Y Estándares De La Industria
Predeterminadas Para Un Uso Rápido Y Eficiente
Compatible con MAC / PC, completamente desbloqueado
No Se Necesita Experiencia; Fáciles De Seguir
iBio, Inc. (IBIO) Bundle
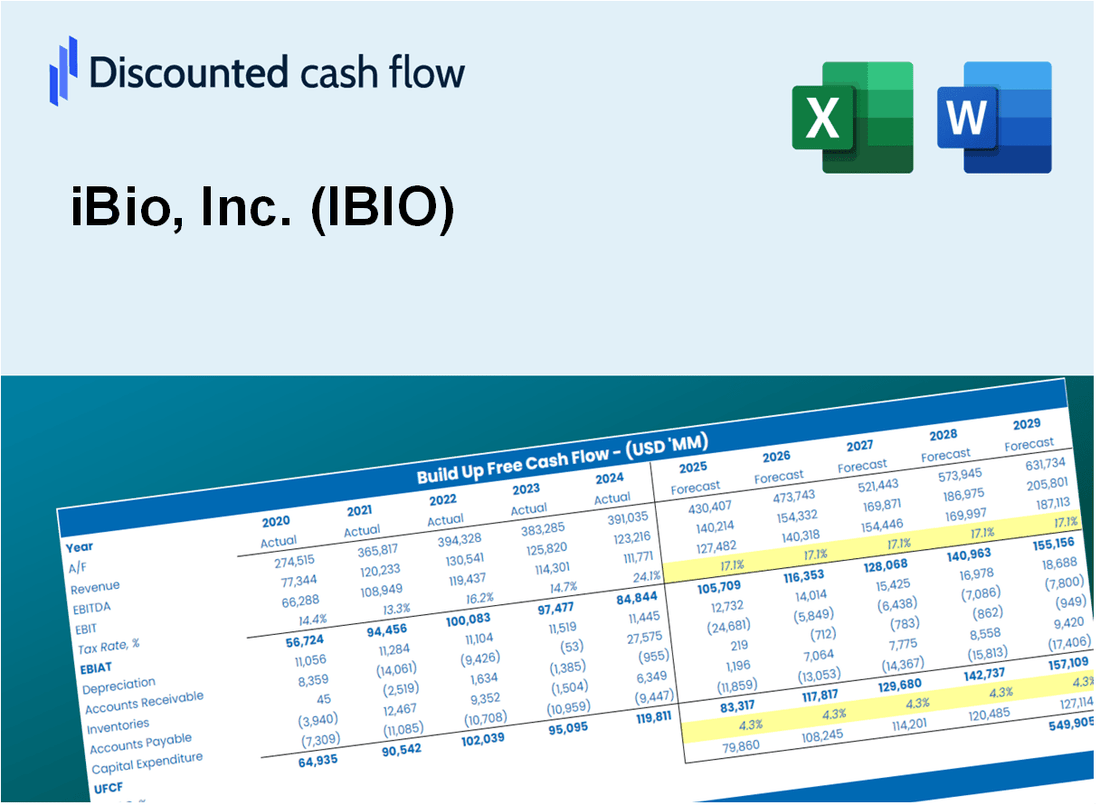
¡Explore el futuro financiero IBIO, Inc. (IBIO) con nuestra calculadora DCF fácil de usar! Ingrese sus proyecciones para el crecimiento, los márgenes y los gastos para calcular el valor intrínseco de IBIO, Inc. (IBIO) y dar forma a su enfoque de inversión.
What You Will Get
- Editable Forecast Inputs: Effortlessly modify key assumptions (growth %, margins, WACC) to explore various scenarios.
- Real-World Data: iBio, Inc.'s (IBIO) financial data pre-loaded to facilitate your analysis.
- Automatic DCF Outputs: The template computes Net Present Value (NPV) and intrinsic value automatically for you.
- Customizable and Professional: A sleek Excel model designed to meet your valuation requirements.
- Built for Analysts and Investors: Perfect for evaluating projections, confirming strategies, and optimizing your time.
Key Features
- Customizable Growth Metrics: Adjust essential variables such as revenue projections, gross margin %, and R&D expenditures.
- Instant DCF Analysis: Automatically computes intrinsic value, NPV, and various financial metrics in real-time.
- High-Precision Results: Leverages iBio’s actual financial data for accurate and reliable valuation insights.
- Streamlined Scenario Simulation: Effortlessly evaluate different scenarios and analyze their impacts.
- Efficiency Booster: Remove the complexity of creating detailed valuation models from the ground up.
How It Works
- Step 1: Download the Excel file for iBio, Inc. (IBIO).
- Step 2: Review the pre-entered data for iBio, including historical and projected figures.
- Step 3: Modify key assumptions (highlighted in yellow) based on your analysis.
- Step 4: Observe the automatic recalculations for iBio’s intrinsic value.
- Step 5: Utilize the results for making investment decisions or for reporting purposes.
Why Choose This Calculator for iBio, Inc. (IBIO)?
- Designed for Experts: A sophisticated tool tailored for analysts, CFOs, and biotech consultants.
- Accurate Data: iBio’s historical and projected financials are preloaded for precise calculations.
- Flexible Scenario Analysis: Effortlessly test various forecasts and assumptions.
- Comprehensive Outputs: Automatically computes intrinsic value, NPV, and essential metrics.
- User-Friendly: Step-by-step guidance ensures a smooth experience throughout the process.
Who Should Use iBio, Inc. (IBIO)?
- Investors: Gain insights into biopharmaceutical advancements with a reliable investment analysis tool.
- Research Analysts: Streamline your evaluation process with comprehensive data on iBio's innovations.
- Consultants: Tailor reports and presentations efficiently by leveraging iBio's market strategies.
- Biotech Enthusiasts: Enhance your knowledge of biotechnology developments through detailed case studies.
- Educators and Students: Utilize iBio's resources as a valuable asset in biotechnology and finance curricula.
What the Template Contains
- Comprehensive DCF Model: Editable template featuring detailed valuation calculations for iBio, Inc. (IBIO).
- Real-World Data: iBio’s historical and projected financials preloaded for in-depth analysis.
- Customizable Parameters: Adjust WACC, growth rates, and tax assumptions to explore various scenarios.
- Financial Statements: Complete annual and quarterly breakdowns for enhanced insights into performance.
- Key Ratios: Integrated analysis for profitability, efficiency, and leverage metrics.
- Dashboard with Visual Outputs: Visualizations and tables for clear, actionable results pertaining to iBio, Inc. (IBIO).
Disclaimer
All information, articles, and product details provided on this website are for general informational and educational purposes only. We do not claim any ownership over, nor do we intend to infringe upon, any trademarks, copyrights, logos, brand names, or other intellectual property mentioned or depicted on this site. Such intellectual property remains the property of its respective owners, and any references here are made solely for identification or informational purposes, without implying any affiliation, endorsement, or partnership.
We make no representations or warranties, express or implied, regarding the accuracy, completeness, or suitability of any content or products presented. Nothing on this website should be construed as legal, tax, investment, financial, medical, or other professional advice. In addition, no part of this site—including articles or product references—constitutes a solicitation, recommendation, endorsement, advertisement, or offer to buy or sell any securities, franchises, or other financial instruments, particularly in jurisdictions where such activity would be unlawful.
All content is of a general nature and may not address the specific circumstances of any individual or entity. It is not a substitute for professional advice or services. Any actions you take based on the information provided here are strictly at your own risk. You accept full responsibility for any decisions or outcomes arising from your use of this website and agree to release us from any liability in connection with your use of, or reliance upon, the content or products found herein.