
|
Ibotta, Inc. (IBTA) DCF Valoración |
Completamente Editable: Adáptelo A Sus Necesidades En Excel O Sheets
Diseño Profesional: Plantillas Confiables Y Estándares De La Industria
Predeterminadas Para Un Uso Rápido Y Eficiente
Compatible con MAC / PC, completamente desbloqueado
No Se Necesita Experiencia; Fáciles De Seguir
Ibotta, Inc. (IBTA) Bundle
¡Evalúe la perspectiva financiera de Ibotta, Inc. como un experto! Esta calculadora DCF (IBTA) le proporciona datos financieros precipitados y la libertad de modificar el crecimiento de los ingresos, WACC, los márgenes y otros supuestos esenciales para alinearse con sus predicciones.
Benefits of Choosing Ibotta, Inc. (IBTA)
- Pre-Filled Financial Model: Utilize Ibotta’s actual performance data for an accurate DCF valuation.
- Comprehensive Forecast Control: Easily modify revenue growth, margins, WACC, and other critical factors.
- Real-Time Calculations: Automatic updates allow you to see results instantly as you make adjustments.
- Professional-Grade Template: A polished Excel file tailored for high-quality valuation analysis.
- Customizable and Reusable: Designed for adaptability, enabling repeated use for thorough forecasts.
Key Features
- 🔍 Real-Life IBTA Financials: Pre-filled historical and projected data for Ibotta, Inc.
- ✏️ Fully Customizable Inputs: Modify all essential parameters (yellow cells) such as WACC, growth %, and tax rates.
- 📊 Professional DCF Valuation: Integrated formulas calculate Ibotta’s intrinsic value using the Discounted Cash Flow method.
- ⚡ Instant Results: View Ibotta’s valuation instantly after making any adjustments.
- Scenario Analysis: Evaluate and compare different outcomes based on various financial assumptions side-by-side.
How It Works
- Step 1: Download the Excel file.
- Step 2: Review the pre-filled Ibotta data (historical and projected).
- Step 3: Modify key assumptions (highlighted in yellow) according to your analysis.
- Step 4: Observe the automatic recalculations for Ibotta’s intrinsic value.
- Step 5: Utilize the results for informed investment choices or reporting.
Why Opt for This Calculator?
- Precise Data: Authentic Ibotta financials guarantee trustworthy valuation outcomes.
- Flexible: Modify essential factors such as growth rates, WACC, and tax rates to align with your forecasts.
- Efficiency: Ready-to-use calculations save you the hassle of building from the ground up.
- Professional-Quality Tool: Crafted for investors, analysts, and consultants.
- Easy to Use: User-friendly design and clear, step-by-step guidance ensure accessibility for everyone.
Who Can Benefit from Ibotta, Inc. (IBTA)?
- Individual Investors: Gain insights to make informed decisions regarding Ibotta stock.
- Financial Analysts: Enhance valuation methodologies with accessible financial models tailored for Ibotta.
- Consultants: Provide accurate and timely valuation analysis for clients interested in Ibotta.
- Business Owners: Learn about the valuation of innovative companies like Ibotta to inform your own business strategies.
- Finance Students: Acquire practical valuation skills by working with real data and case studies related to Ibotta.
Contents of the Template
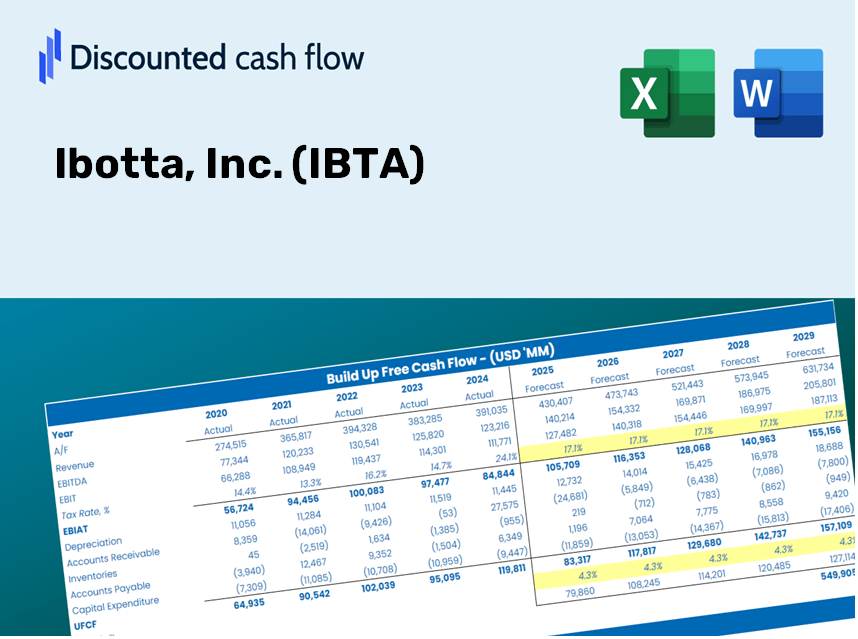
- Operating and Balance Sheet Data: Pre-filled historical data and forecasts for Ibotta, Inc. (IBTA), including revenue, EBITDA, EBIT, and capital expenditures.
- WACC Calculation: A separate sheet for calculating the Weighted Average Cost of Capital (WACC), encompassing parameters such as Beta, risk-free rate, and share price.
- DCF Valuation (Unlevered and Levered): Customizable Discounted Cash Flow models that illustrate intrinsic value along with comprehensive calculations.
- Financial Statements: Pre-loaded financial statements (both annual and quarterly) to facilitate thorough analysis.
- Key Ratios: Detailed profitability, leverage, and efficiency ratios specific to Ibotta, Inc. (IBTA).
- Dashboard and Charts: A visual overview of valuation outputs and assumptions, designed for straightforward analysis of results.
Disclaimer
All information, articles, and product details provided on this website are for general informational and educational purposes only. We do not claim any ownership over, nor do we intend to infringe upon, any trademarks, copyrights, logos, brand names, or other intellectual property mentioned or depicted on this site. Such intellectual property remains the property of its respective owners, and any references here are made solely for identification or informational purposes, without implying any affiliation, endorsement, or partnership.
We make no representations or warranties, express or implied, regarding the accuracy, completeness, or suitability of any content or products presented. Nothing on this website should be construed as legal, tax, investment, financial, medical, or other professional advice. In addition, no part of this site—including articles or product references—constitutes a solicitation, recommendation, endorsement, advertisement, or offer to buy or sell any securities, franchises, or other financial instruments, particularly in jurisdictions where such activity would be unlawful.
All content is of a general nature and may not address the specific circumstances of any individual or entity. It is not a substitute for professional advice or services. Any actions you take based on the information provided here are strictly at your own risk. You accept full responsibility for any decisions or outcomes arising from your use of this website and agree to release us from any liability in connection with your use of, or reliance upon, the content or products found herein.