
|
Valoración de DCF del Grupo de Capital Intermedio (ICG.L) |
Completamente Editable: Adáptelo A Sus Necesidades En Excel O Sheets
Diseño Profesional: Plantillas Confiables Y Estándares De La Industria
Predeterminadas Para Un Uso Rápido Y Eficiente
Compatible con MAC / PC, completamente desbloqueado
No Se Necesita Experiencia; Fáciles De Seguir
Intermediate Capital Group plc (ICG.L) Bundle
¡Evalúe las perspectivas financieras del grupo de capital intermedio PLC (ICGL) como un experto! Esta calculadora DCF (ICGL) proporciona datos financieros previamente llenos y flexibilidad completa para modificar el crecimiento de los ingresos, WACC, los márgenes y otros supuestos cruciales para alinearse con sus proyecciones.
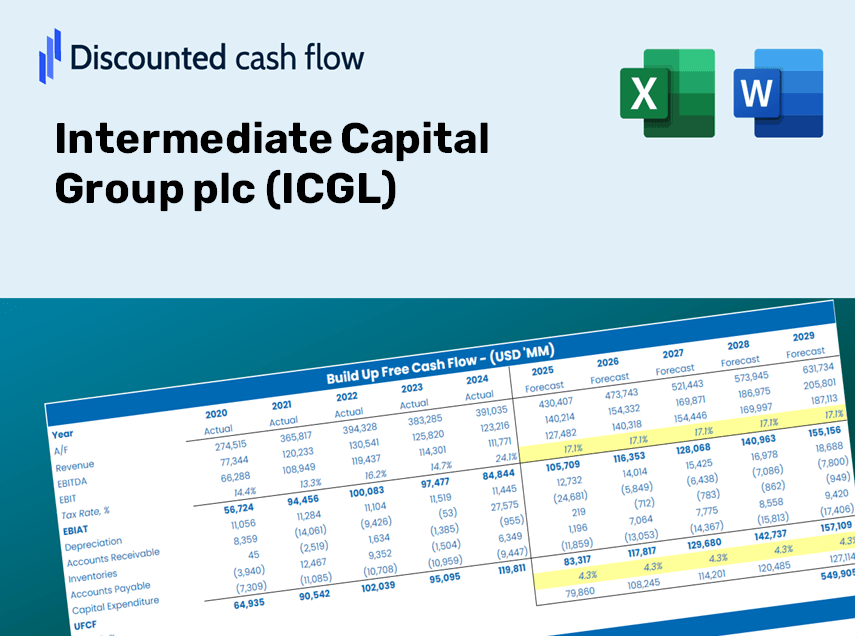
Discounted Cash Flow (DCF) - (USD MM)
| Year | AY1 2021 |
AY2 2022 |
AY3 2023 |
AY4 2024 |
AY5 2025 |
FY1 2026 |
FY2 2027 |
FY3 2028 |
FY4 2029 |
FY5 2030 |
|---|---|---|---|---|---|---|---|---|---|---|
| Revenue | 672.4 | 989.5 | 599.0 | 981.7 | 990.4 | 1,169.8 | 1,381.8 | 1,632.1 | 1,927.8 | 2,277.1 |
| Revenue Growth, % | 0 | 47.16 | -39.46 | 63.89 | 0.88622 | 18.12 | 18.12 | 18.12 | 18.12 | 18.12 |
| EBITDA | 585.3 | 637.1 | .0 | 598.7 | 548.3 | 626.5 | 740.0 | 874.1 | 1,032.5 | 1,219.5 |
| EBITDA, % | 87.05 | 64.39 | 0 | 60.99 | 55.36 | 53.56 | 53.56 | 53.56 | 53.56 | 53.56 |
| Depreciation | 15.6 | 19.5 | 18.2 | 18.0 | 17.8 | 25.6 | 30.3 | 35.8 | 42.3 | 49.9 |
| Depreciation, % | 2.32 | 1.97 | 3.04 | 1.83 | 1.8 | 2.19 | 2.19 | 2.19 | 2.19 | 2.19 |
| EBIT | 569.7 | 617.6 | -18.2 | 580.7 | 530.5 | 600.9 | 709.7 | 838.3 | 990.2 | 1,169.6 |
| EBIT, % | 84.73 | 62.42 | -3.04 | 59.15 | 53.56 | 51.36 | 51.36 | 51.36 | 51.36 | 51.36 |
| Total Cash | 296.9 | 761.5 | 550.0 | 990.0 | 604.8 | 875.0 | 1,033.6 | 1,220.8 | 1,442.0 | 1,703.3 |
| Total Cash, percent | .0 | .0 | .0 | .0 | .0 | .0 | .0 | .0 | .0 | .0 |
| Account Receivables | 269.4 | 371.4 | 259.1 | .0 | 461.5 | 391.8 | 462.8 | 546.6 | 645.6 | 762.6 |
| Account Receivables, % | 40.07 | 37.53 | 43.26 | 0 | 46.6 | 33.49 | 33.49 | 33.49 | 33.49 | 33.49 |
| Inventories | 919.6 | 1,395.1 | 1,278.3 | .0 | .0 | 701.9 | 829.1 | 979.3 | 1,156.7 | 1,366.3 |
| Inventories, % | 136.76 | 140.99 | 213.41 | 0 | 0 | 60 | 60 | 60 | 60 | 60 |
| Accounts Payable | 427.3 | 434.4 | 468.3 | 525.9 | 554.5 | 690.6 | 815.8 | 963.6 | 1,138.2 | 1,344.4 |
| Accounts Payable, % | 63.55 | 43.9 | 78.18 | 53.57 | 55.99 | 59.04 | 59.04 | 59.04 | 59.04 | 59.04 |
| Capital Expenditure | -10.8 | -7.8 | -11.2 | -9.5 | -6.6 | -13.8 | -16.3 | -19.3 | -22.7 | -26.9 |
| Capital Expenditure, % | -1.61 | -0.78828 | -1.87 | -0.96771 | -0.6664 | -1.18 | -1.18 | -1.18 | -1.18 | -1.18 |
| Tax Rate, % | 14.95 | 14.95 | 14.95 | 14.95 | 14.95 | 14.95 | 14.95 | 14.95 | 14.95 | 14.95 |
| EBITAT | 511.1 | 574.9 | -20.3 | 517.9 | 451.2 | 549.3 | 648.8 | 766.3 | 905.1 | 1,069.1 |
| Depreciation | ||||||||||
| Changes in Account Receivables | ||||||||||
| Changes in Inventories | ||||||||||
| Changes in Accounts Payable | ||||||||||
| Capital Expenditure | ||||||||||
| UFCF | -245.8 | 16.2 | 249.7 | 2,121.4 | 29.5 | 65.1 | 589.7 | 696.6 | 822.8 | 971.9 |
| WACC, % | 7.86 | 7.92 | 8.05 | 7.86 | 7.78 | 7.89 | 7.89 | 7.89 | 7.89 | 7.89 |
| PV UFCF | ||||||||||
| SUM PV UFCF | 2,393.3 | |||||||||
| Long Term Growth Rate, % | 2.00 | |||||||||
| Free cash flow (T + 1) | 991 | |||||||||
| Terminal Value | 16,817 | |||||||||
| Present Terminal Value | 11,501 | |||||||||
| Enterprise Value | 13,895 | |||||||||
| Net Debt | 5,501 | |||||||||
| Equity Value | 8,393 | |||||||||
| Diluted Shares Outstanding, MM | 293 | |||||||||
| Equity Value Per Share | 2,860.75 |
What You Will Receive
- Adjustable Forecast Inputs: Effortlessly modify assumptions (growth %, margins, WACC) to explore various scenarios.
- Real-World Data: Intermediate Capital Group plc’s (ICGL) financial details pre-loaded to facilitate your analysis.
- Automated DCF Outputs: The template computes Net Present Value (NPV) and intrinsic value automatically.
- Tailored and Professional: A refined Excel model designed to meet your valuation requirements.
- Engineered for Analysts and Investors: Perfect for testing forecasts, validating strategies, and saving valuable time.
Key Features
- Pre-Loaded Data: Historical financial statements and pre-populated forecasts for Intermediate Capital Group plc (ICGL).
- Fully Adjustable Inputs: Customize WACC, tax rates, revenue growth, and EBITDA margins as needed.
- Instant Results: View real-time recalculations of Intermediate Capital Group plc’s (ICGL) intrinsic value.
- Clear Visual Outputs: Engaging dashboard charts illustrate valuation results and essential metrics.
- Built for Accuracy: A reliable tool designed for analysts, investors, and finance professionals.
How It Works
- Step 1: Download the Excel file.
- Step 2: Review the pre-filled data for Intermediate Capital Group plc (ICGL), including historical performance and future projections.
- Step 3: Modify key assumptions (yellow cells) according to your financial analysis.
- Step 4: Observe the automatic recalculations reflecting the intrinsic value of Intermediate Capital Group plc (ICGL).
- Step 5: Utilize the results for making informed investment decisions or for reporting purposes.
Why Choose This Calculator for Intermediate Capital Group (ICGL)?
- Precision: Leveraging authentic ICGL financial data to guarantee accuracy.
- Adaptability: Tailored for users to effortlessly adjust and test various inputs.
- Efficiency: Eliminate the complexities of creating a DCF model from the ground up.
- Expert-Level: Crafted with the precision and usability expected by CFOs.
- Intuitive: Designed for simplicity, suitable for individuals without extensive financial modeling skills.
Who Can Benefit from This Product?
- Finance Students: Master valuation techniques and practice them with actual data.
- Academics: Integrate professional valuation models into your classes or research initiatives.
- Investors: Evaluate your own hypotheses and explore valuation results for Intermediate Capital Group plc (ICGL).
- Analysts: Enhance your efficiency with a customizable, ready-to-use DCF model.
- Small Business Owners: Understand how large public firms like Intermediate Capital Group plc (ICGL) are evaluated.
Overview of the Template Components
- Historical Data: Contains past financial information and baseline forecasts for Intermediate Capital Group plc (ICGL).
- DCF and Levered DCF Models: Comprehensive templates to evaluate the intrinsic value of Intermediate Capital Group plc (ICGL).
- WACC Sheet: Ready-to-use calculations for the Weighted Average Cost of Capital.
- Editable Inputs: Adjust critical variables such as growth rates, EBITDA percentages, and CAPEX assumptions.
- Quarterly and Annual Statements: An extensive overview of Intermediate Capital Group plc (ICGL)’s financial performance.
- Interactive Dashboard: Dynamic visualization of valuation outcomes and forecasts.
Disclaimer
All information, articles, and product details provided on this website are for general informational and educational purposes only. We do not claim any ownership over, nor do we intend to infringe upon, any trademarks, copyrights, logos, brand names, or other intellectual property mentioned or depicted on this site. Such intellectual property remains the property of its respective owners, and any references here are made solely for identification or informational purposes, without implying any affiliation, endorsement, or partnership.
We make no representations or warranties, express or implied, regarding the accuracy, completeness, or suitability of any content or products presented. Nothing on this website should be construed as legal, tax, investment, financial, medical, or other professional advice. In addition, no part of this site—including articles or product references—constitutes a solicitation, recommendation, endorsement, advertisement, or offer to buy or sell any securities, franchises, or other financial instruments, particularly in jurisdictions where such activity would be unlawful.
All content is of a general nature and may not address the specific circumstances of any individual or entity. It is not a substitute for professional advice or services. Any actions you take based on the information provided here are strictly at your own risk. You accept full responsibility for any decisions or outcomes arising from your use of this website and agree to release us from any liability in connection with your use of, or reliance upon, the content or products found herein.