
|
Valoración DCF de ICON Public Limited Company (ICLR) |
Completamente Editable: Adáptelo A Sus Necesidades En Excel O Sheets
Diseño Profesional: Plantillas Confiables Y Estándares De La Industria
Predeterminadas Para Un Uso Rápido Y Eficiente
Compatible con MAC / PC, completamente desbloqueado
No Se Necesita Experiencia; Fáciles De Seguir
ICON Public Limited Company (ICLR) Bundle
¡Obtenga dominio sobre su análisis de valoración de Icon Public Limited Company (ICLR) utilizando nuestra sofisticada calculadora DCF! Esta plantilla de Excel viene precargada con los datos reales de ICLR, lo que le permite ajustar los pronósticos y los supuestos para calcular con precisión el valor intrínseco de Icon Public Limited Company.
What You Will Get
- Editable Forecast Inputs: Easily modify assumptions (growth %, margins, WACC) to explore various scenarios.
- Real-World Data: ICON Public Limited Company’s (ICLR) financial data pre-loaded to accelerate your analysis.
- Automatic DCF Outputs: The template computes Net Present Value (NPV) and intrinsic value automatically.
- Customizable and Professional: A sleek Excel model that adjusts to meet your valuation requirements.
- Built for Analysts and Investors: Perfect for evaluating projections, confirming strategies, and enhancing efficiency.
Key Features
- Comprehensive DCF Calculator: Features both unlevered and levered DCF valuation models tailored for ICON Public Limited Company (ICLR).
- WACC Calculator: Pre-configured Weighted Average Cost of Capital sheet with adjustable inputs for personalized analysis.
- Customizable Forecast Assumptions: Easily adjust growth rates, capital expenditures, and discount rates to fit your analysis.
- Integrated Financial Ratios: Evaluate profitability, leverage, and efficiency ratios specifically for ICON Public Limited Company (ICLR).
- Interactive Dashboard and Charts: Visual representations that summarize essential valuation metrics for straightforward interpretation.
How It Works
- Download: Obtain the pre-configured Excel file containing ICON Public Limited Company's (ICLR) financial data.
- Customize: Modify projections such as revenue growth, EBITDA %, and WACC to fit your analysis.
- Update Automatically: Enjoy real-time updates on intrinsic value and NPV calculations.
- Test Scenarios: Generate various projections and instantly compare potential outcomes.
- Make Decisions: Leverage the valuation insights to inform your investment choices.
Why Choose ICON Public Limited Company (ICLR)?
- Time-Efficient: Access comprehensive financial tools without the hassle of starting from scratch.
- Enhanced Precision: Utilize accurate financial data and methodologies to minimize valuation discrepancies.
- Completely Customizable: Adjust the model to align with your specific assumptions and forecasts.
- User-Friendly: Intuitive charts and outputs facilitate straightforward analysis of results.
- Endorsed by Professionals: Crafted for experts who prioritize accuracy and ease of use.
Who Should Use This Product?
- Professional Investors: Develop comprehensive and trustworthy valuation models for analyzing ICLR portfolios.
- Corporate Finance Teams: Evaluate valuation scenarios to inform strategic decisions within the organization.
- Consultants and Advisors: Deliver precise valuation insights for clients interested in ICON Public Limited Company (ICLR).
- Students and Educators: Utilize real-world data to enhance learning and practice in financial modeling.
- Healthcare Sector Enthusiasts: Gain insights into how companies like ICON Public Limited Company (ICLR) are valued in the biotechnology market.
What the Template Contains
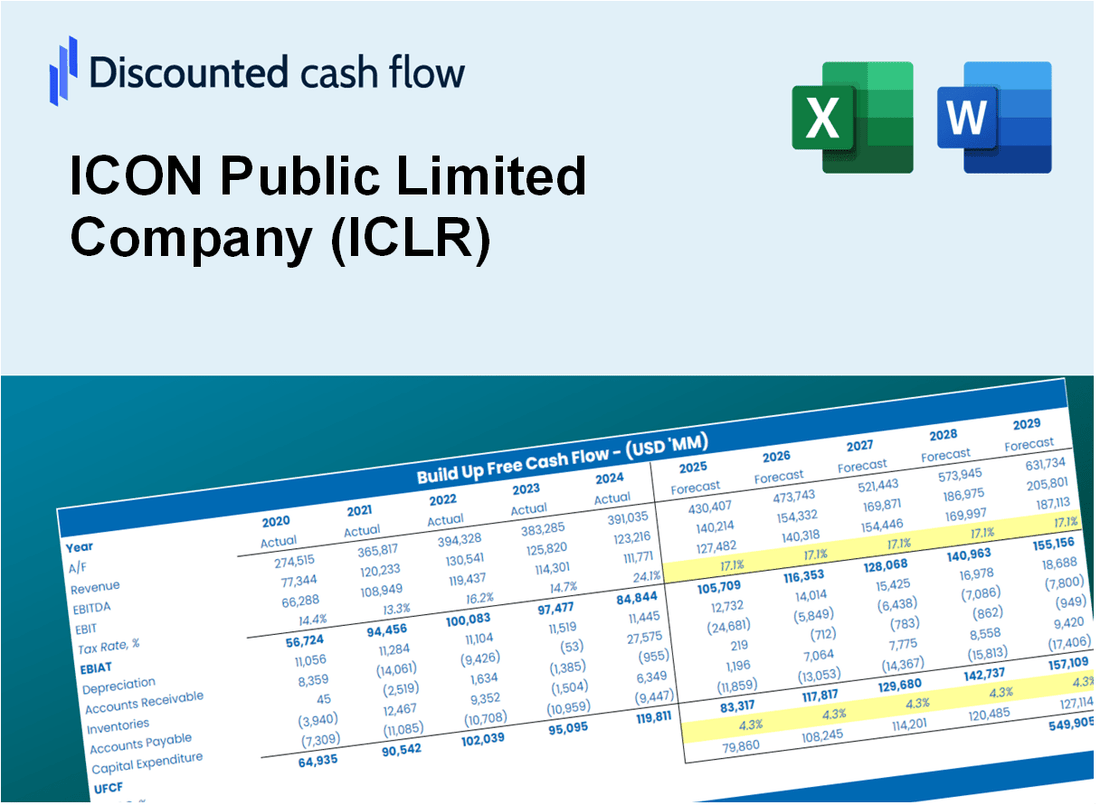
- Operating and Balance Sheet Data: Pre-filled ICON Public Limited Company (ICLR) historical data and forecasts, including revenue, EBITDA, EBIT, and capital expenditures.
- WACC Calculation: A dedicated sheet for Weighted Average Cost of Capital (WACC), including parameters like Beta, risk-free rate, and share price.
- DCF Valuation (Unlevered and Levered): Editable Discounted Cash Flow models showing intrinsic value with detailed calculations.
- Financial Statements: Pre-loaded financial statements (annual and quarterly) to support analysis.
- Key Ratios: Includes profitability, leverage, and efficiency ratios for ICON Public Limited Company (ICLR).
- Dashboard and Charts: Visual summary of valuation outputs and assumptions to analyze results easily.
Disclaimer
All information, articles, and product details provided on this website are for general informational and educational purposes only. We do not claim any ownership over, nor do we intend to infringe upon, any trademarks, copyrights, logos, brand names, or other intellectual property mentioned or depicted on this site. Such intellectual property remains the property of its respective owners, and any references here are made solely for identification or informational purposes, without implying any affiliation, endorsement, or partnership.
We make no representations or warranties, express or implied, regarding the accuracy, completeness, or suitability of any content or products presented. Nothing on this website should be construed as legal, tax, investment, financial, medical, or other professional advice. In addition, no part of this site—including articles or product references—constitutes a solicitation, recommendation, endorsement, advertisement, or offer to buy or sell any securities, franchises, or other financial instruments, particularly in jurisdictions where such activity would be unlawful.
All content is of a general nature and may not address the specific circumstances of any individual or entity. It is not a substitute for professional advice or services. Any actions you take based on the information provided here are strictly at your own risk. You accept full responsibility for any decisions or outcomes arising from your use of this website and agree to release us from any liability in connection with your use of, or reliance upon, the content or products found herein.