
|
Indian Energy Exchange Limited (IEX.NS) DCF Valoración |
Completamente Editable: Adáptelo A Sus Necesidades En Excel O Sheets
Diseño Profesional: Plantillas Confiables Y Estándares De La Industria
Predeterminadas Para Un Uso Rápido Y Eficiente
Compatible con MAC / PC, completamente desbloqueado
No Se Necesita Experiencia; Fáciles De Seguir
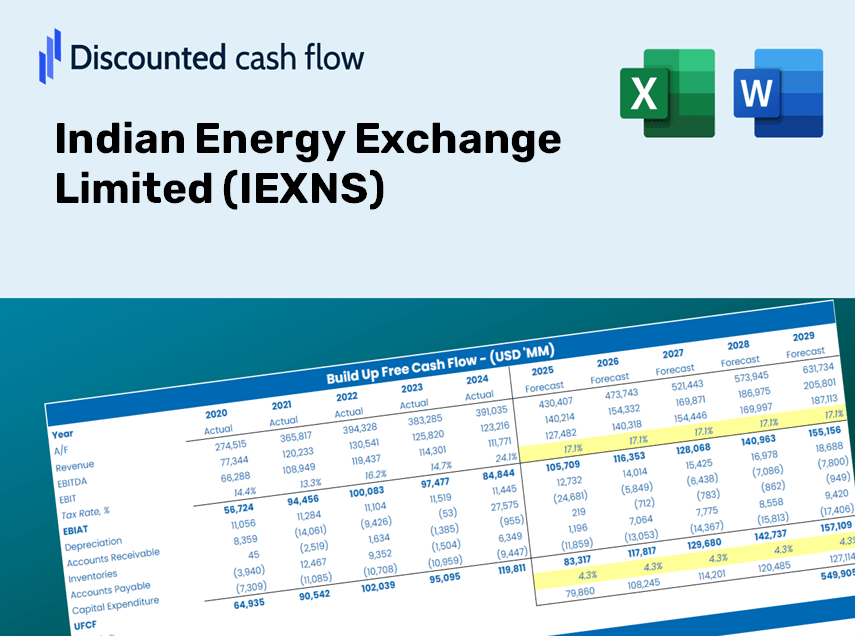
Indian Energy Exchange Limited (IEX.NS) Bundle
¿Busca determinar el valor intrínseco de Indian Energy Exchange Limited? Nuestra calculadora DCF (IEXNS) integra datos del mundo real con características integrales de personalización, lo que le permite ajustar los pronósticos y mejorar sus opciones de inversión.
Discounted Cash Flow (DCF) - (USD MM)
| Year | AY1 2021 |
AY2 2022 |
AY3 2023 |
AY4 2024 |
AY5 2025 |
FY1 2026 |
FY2 2027 |
FY3 2028 |
FY4 2029 |
FY5 2030 |
|---|---|---|---|---|---|---|---|---|---|---|
| Revenue | 3,176.1 | 4,312.8 | 4,008.5 | 5,508.5 | 5,368.0 | 6,221.6 | 7,210.9 | 8,357.5 | 9,686.5 | 11,226.7 |
| Revenue Growth, % | 0 | 35.79 | -7.05 | 37.42 | -2.55 | 15.9 | 15.9 | 15.9 | 15.9 | 15.9 |
| EBITDA | 2,890.1 | 4,230.0 | 4,096.2 | 4,894.5 | 5,737.7 | 5,947.0 | 6,892.7 | 7,988.7 | 9,259.0 | 10,731.2 |
| EBITDA, % | 91 | 98.08 | 102.19 | 88.85 | 106.89 | 95.59 | 95.59 | 95.59 | 95.59 | 95.59 |
| Depreciation | 165.1 | 172.3 | 185.9 | 204.7 | 212.5 | 267.6 | 310.2 | 359.5 | 416.6 | 482.9 |
| Depreciation, % | 5.2 | 3.99 | 4.64 | 3.72 | 3.96 | 4.3 | 4.3 | 4.3 | 4.3 | 4.3 |
| EBIT | 2,725.0 | 4,057.7 | 3,910.3 | 4,689.8 | 5,525.2 | 5,755.9 | 6,671.1 | 7,731.9 | 8,961.4 | 10,386.3 |
| EBIT, % | 85.8 | 94.09 | 97.55 | 85.14 | 102.93 | 92.51 | 92.51 | 92.51 | 92.51 | 92.51 |
| Total Cash | 7,023.6 | 13,725.1 | 7,545.7 | 9,326.5 | 12,906.3 | 6,221.6 | 7,210.9 | 8,357.5 | 9,686.5 | 11,226.7 |
| Total Cash, percent | .0 | .0 | .0 | .0 | .0 | .0 | .0 | .0 | .0 | .0 |
| Account Receivables | 32.0 | 881.4 | 73.8 | 862.7 | 26.2 | 490.7 | 568.7 | 659.1 | 763.9 | 885.4 |
| Account Receivables, % | 1.01 | 20.44 | 1.84 | 15.66 | 0.48805 | 7.89 | 7.89 | 7.89 | 7.89 | 7.89 |
| Inventories | .0 | -6,164.1 | -3,245.3 | -857.6 | .0 | -2,445.4 | -2,834.3 | -3,285.0 | -3,807.3 | -4,412.7 |
| Inventories, % | 0 | -142.93 | -80.96 | -15.57 | 0 | -39.31 | -39.31 | -39.31 | -39.31 | -39.31 |
| Accounts Payable | 1,659.0 | 6,351.7 | 4,024.2 | 5,626.7 | 35.0 | 4,391.1 | 5,089.3 | 5,898.5 | 6,836.5 | 7,923.5 |
| Accounts Payable, % | 52.24 | 147.27 | 100.39 | 102.15 | 0.65115 | 70.58 | 70.58 | 70.58 | 70.58 | 70.58 |
| Capital Expenditure | -209.6 | -110.7 | -90.2 | -153.0 | -78.5 | -194.8 | -225.8 | -261.7 | -303.4 | -351.6 |
| Capital Expenditure, % | -6.6 | -2.57 | -2.25 | -2.78 | -1.46 | -3.13 | -3.13 | -3.13 | -3.13 | -3.13 |
| Tax Rate, % | 23.98 | 23.98 | 23.98 | 23.98 | 23.98 | 23.98 | 23.98 | 23.98 | 23.98 | 23.98 |
| EBITAT | 2,076.6 | 3,096.6 | 2,976.7 | 3,529.2 | 4,200.4 | 4,373.5 | 5,068.9 | 5,874.9 | 6,809.1 | 7,891.9 |
| Depreciation | ||||||||||
| Changes in Account Receivables | ||||||||||
| Changes in Inventories | ||||||||||
| Changes in Accounts Payable | ||||||||||
| Capital Expenditure | ||||||||||
| UFCF | 3,659.1 | 13,165.5 | -1,366.3 | 2,006.8 | -1,278.5 | 10,783.3 | 6,162.3 | 7,142.2 | 8,277.9 | 9,594.2 |
| WACC, % | 5.49 | 5.49 | 5.49 | 5.49 | 5.49 | 5.49 | 5.49 | 5.49 | 5.49 | 5.49 |
| PV UFCF | ||||||||||
| SUM PV UFCF | 35,874.1 | |||||||||
| Long Term Growth Rate, % | 2.00 | |||||||||
| Free cash flow (T + 1) | 9,786 | |||||||||
| Terminal Value | 280,514 | |||||||||
| Present Terminal Value | 214,747 | |||||||||
| Enterprise Value | 250,621 | |||||||||
| Net Debt | -1,068 | |||||||||
| Equity Value | 251,689 | |||||||||
| Diluted Shares Outstanding, MM | 889 | |||||||||
| Equity Value Per Share | 283.26 |
What You Will Receive
- Authentic IEXNS Data: Preloaded financial metrics – covering revenue, EBIT, and more – derived from actual and projected figures.
- Complete Customization: Modify all essential parameters (yellow cells) such as WACC, growth rates, and tax percentages.
- Real-Time Valuation Adjustments: Automatic updates that allow you to evaluate the effects of changes on IEXNS’s fair value.
- Flexible Excel Template: Designed for quick modifications, scenario analysis, and thorough forecasting.
- Efficient and Precise: Eliminate the need to create models from the ground up while ensuring accuracy and adaptability.
Key Features
- 🔍 Real-Life IEXNS Financials: Access pre-populated historical and forecast data for Indian Energy Exchange Limited.
- ✏️ Fully Customizable Inputs: Modify essential parameters (highlighted cells) such as WACC, growth %, and tax rates.
- 📊 Professional DCF Valuation: Utilize integrated formulas to compute the intrinsic value of Indian Energy Exchange using the Discounted Cash Flow method.
- ⚡ Instant Results: Immediately observe the valuation of Indian Energy Exchange after any adjustments.
- Scenario Analysis: Evaluate and compare results across different financial assumptions side-by-side.
How It Works
- Step 1: Download the prebuilt Excel template featuring Indian Energy Exchange Limited’s (IEXNS) data.
- Step 2: Navigate through the pre-filled sheets to familiarize yourself with the essential metrics.
- Step 3: Modify forecasts and assumptions in the editable yellow cells (WACC, growth, margins).
- Step 4: Instantly see the recalculated results, including Indian Energy Exchange Limited’s (IEXNS) intrinsic value.
- Step 5: Use the outputs to make well-informed investment decisions or create reports.
Why Choose the IEXNS Calculator?
- All-in-One Tool: Features DCF, WACC, and financial ratio analyses seamlessly integrated.
- Flexible Inputs: Easily modify the highlighted fields to explore different scenarios.
- In-Depth Analysis: Automatically computes the intrinsic value and Net Present Value for Indian Energy Exchange Limited (IEXNS).
- Built-In Data: Contains historical and projected data for reliable starting points.
- High-Quality Standards: Perfectly suited for financial analysts, investors, and business consultants.
Who Can Benefit from Indian Energy Exchange Limited (IEXNS)?
- Investors: Make informed choices with our advanced market analysis tools.
- Energy Analysts: Streamline your workflow with our comprehensive trading models ready for customization.
- Consultants: Efficiently tailor our resources for client presentations and strategic reports.
- Energy Enthusiasts: Enhance your knowledge of market dynamics through practical examples.
- Educators and Students: Utilize our platform as a hands-on learning resource for energy market studies.
What the Template Contains for Indian Energy Exchange Limited (IEXNS)
- Pre-Filled Data: Contains historical financials and forecasts for Indian Energy Exchange Limited.
- Discounted Cash Flow Model: An editable DCF valuation model with automatic calculations tailored for IEXNS.
- Weighted Average Cost of Capital (WACC): A specific sheet to compute WACC based on your custom inputs.
- Key Financial Ratios: Evaluate IEXNS’s profitability, efficiency, and leverage ratios.
- Customizable Inputs: Easily modify revenue growth rates, profit margins, and tax rates.
- Clear Dashboard: Visual representations like charts and tables that summarize key valuation metrics for IEXNS.
Disclaimer
All information, articles, and product details provided on this website are for general informational and educational purposes only. We do not claim any ownership over, nor do we intend to infringe upon, any trademarks, copyrights, logos, brand names, or other intellectual property mentioned or depicted on this site. Such intellectual property remains the property of its respective owners, and any references here are made solely for identification or informational purposes, without implying any affiliation, endorsement, or partnership.
We make no representations or warranties, express or implied, regarding the accuracy, completeness, or suitability of any content or products presented. Nothing on this website should be construed as legal, tax, investment, financial, medical, or other professional advice. In addition, no part of this site—including articles or product references—constitutes a solicitation, recommendation, endorsement, advertisement, or offer to buy or sell any securities, franchises, or other financial instruments, particularly in jurisdictions where such activity would be unlawful.
All content is of a general nature and may not address the specific circumstances of any individual or entity. It is not a substitute for professional advice or services. Any actions you take based on the information provided here are strictly at your own risk. You accept full responsibility for any decisions or outcomes arising from your use of this website and agree to release us from any liability in connection with your use of, or reliance upon, the content or products found herein.