
|
Valoración DCF de I-Mab (IMAB) |
Completamente Editable: Adáptelo A Sus Necesidades En Excel O Sheets
Diseño Profesional: Plantillas Confiables Y Estándares De La Industria
Predeterminadas Para Un Uso Rápido Y Eficiente
Compatible con MAC / PC, completamente desbloqueado
No Se Necesita Experiencia; Fáciles De Seguir
I-Mab (IMAB) Bundle
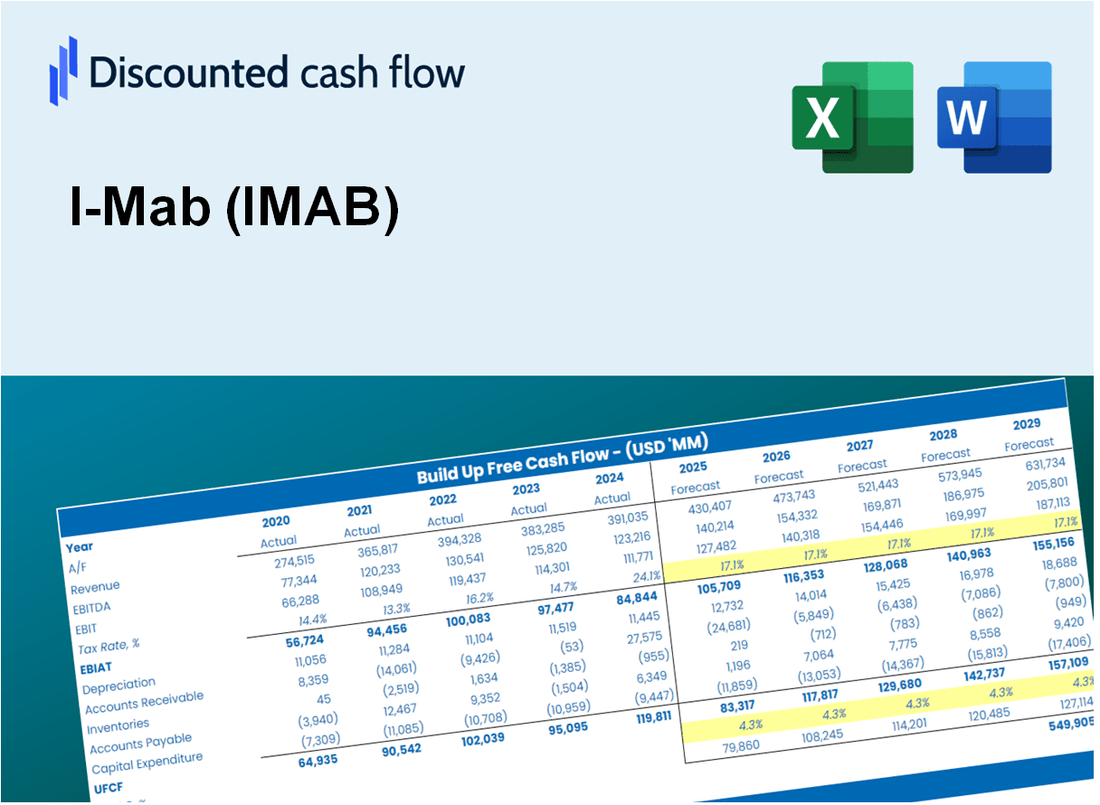
Diseñada para la precisión, nuestra calculadora DCF (IMAB) le permite evaluar la valoración de I-MAB utilizando datos financieros del mundo real, al tiempo que ofrece flexibilidad completa para modificar todos los parámetros esenciales para mejorar las proyecciones.
Discounted Cash Flow (DCF) - (USD MM)
| Year | AY1 2020 |
AY2 2021 |
AY3 2022 |
AY4 2023 |
AY5 2024 |
FY1 2025 |
FY2 2026 |
FY3 2027 |
FY4 2028 |
FY5 2029 |
|---|---|---|---|---|---|---|---|---|---|---|
| Revenue | 216.9 | 12.4 | -1.5 | .6 | .0 | .0 | .0 | .0 | .0 | .0 |
| Revenue Growth, % | 0 | -94.29 | -112.15 | -141.93 | -100 | -98.57 | -98.57 | -98.57 | -98.57 | -98.57 |
| EBITDA | 23.7 | -289.2 | -7.2 | -48.4 | -52.5 | .0 | .0 | .0 | .0 | .0 |
| EBITDA, % | 10.91 | -2337.41 | 478.91 | -7674.2 | 100 | 2.18 | 2.18 | 2.18 | 2.18 | 2.18 |
| Depreciation | 1.8 | 1.9 | .2 | .5 | .3 | .0 | .0 | .0 | .0 | .0 |
| Depreciation, % | 0.82604 | 15.65 | -13.23 | 75.15 | 100 | 35.68 | 35.68 | 35.68 | 35.68 | 35.68 |
| EBIT | 21.9 | -291.2 | -7.4 | -48.9 | -52.8 | .0 | .0 | .0 | .0 | .0 |
| EBIT, % | 10.08 | -2353.06 | 492.14 | -7749.35 | 100 | 2.02 | 2.02 | 2.02 | 2.02 | 2.02 |
| Total Cash | 103.1 | 94.3 | 484.9 | 321.9 | 24.4 | .0 | .0 | .0 | .0 | .0 |
| Total Cash, percent | .0 | .0 | .0 | .1 | .0 | .0 | .0 | .0 | .0 | .0 |
| Account Receivables | 10.0 | 8.6 | .7 | .3 | .2 | .0 | .0 | .0 | .0 | .0 |
| Account Receivables, % | 4.62 | 69.24 | -44.98 | 40.86 | 100 | 33.95 | 33.95 | 33.95 | 33.95 | 33.95 |
| Inventories | .0 | .6 | -11.3 | 4.1 | .0 | .0 | .0 | .0 | .0 | .0 |
| Inventories, % | 0 | 4.85 | 750.45 | 645.48 | 100 | 60.97 | 60.97 | 60.97 | 60.97 | 60.97 |
| Accounts Payable | .0 | .0 | .0 | .0 | .0 | .0 | .0 | .0 | .0 | .0 |
| Accounts Payable, % | 0 | 0 | 0 | 0 | 100 | 20 | 20 | 20 | 20 | 20 |
| Capital Expenditure | -1.1 | -4.2 | -6.4 | .0 | .0 | .0 | .0 | .0 | .0 | .0 |
| Capital Expenditure, % | -0.5191 | -34 | 428.43 | -3.66 | 100 | -7.64 | -7.64 | -7.64 | -7.64 | -7.64 |
| Tax Rate, % | 55.27 | 55.27 | 55.27 | 55.27 | 55.27 | 55.27 | 55.27 | 55.27 | 55.27 | 55.27 |
| EBITAT | 21.3 | -290.8 | -19.1 | -122.7 | -23.6 | .0 | .0 | .0 | .0 | .0 |
| Depreciation | ||||||||||
| Changes in Account Receivables | ||||||||||
| Changes in Inventories | ||||||||||
| Changes in Accounts Payable | ||||||||||
| Capital Expenditure | ||||||||||
| UFCF | 12.0 | -292.2 | -5.5 | -137.2 | -19.2 | .2 | .0 | .0 | .0 | .0 |
| WACC, % | 10.57 | 10.57 | 10.57 | 10.57 | 10.56 | 10.57 | 10.57 | 10.57 | 10.57 | 10.57 |
| PV UFCF | ||||||||||
| SUM PV UFCF | .1 | |||||||||
| Long Term Growth Rate, % | 2.00 | |||||||||
| Free cash flow (T + 1) | 0 | |||||||||
| Terminal Value | 0 | |||||||||
| Present Terminal Value | 0 | |||||||||
| Enterprise Value | 0 | |||||||||
| Net Debt | -9 | |||||||||
| Equity Value | 9 | |||||||||
| Diluted Shares Outstanding, MM | 35 | |||||||||
| Equity Value Per Share | 0.26 |
What You Will Receive
- Customizable Excel Template: A fully adjustable Excel-based DCF Calculator featuring pre-filled real I-Mab (IMAB) financials.
- Authentic Data: Access to historical data and forward-looking estimates (highlighted in the yellow cells).
- Flexible Forecasting: Modify forecast assumptions such as revenue growth, EBITDA %, and WACC.
- Instant Calculations: Quickly observe how your inputs affect I-Mab’s valuation.
- Professional Resource: Designed for investors, CFOs, consultants, and financial analysts.
- Intuitive Layout: Organized for clarity and ease of use, complete with step-by-step guidance.
Key Features
- Comprehensive I-Mab Financials: Gain access to precise pre-loaded historical data and future forecasts.
- Adjustable Forecast Parameters: Modify highlighted cells for key metrics like WACC, growth rates, and profit margins.
- Real-Time Calculations: Instant updates to DCF, Net Present Value (NPV), and cash flow assessments.
- Interactive Dashboard: Clear and informative charts and summaries to illustrate your valuation findings.
- Designed for All Levels: An intuitive layout tailored for investors, CFOs, and consultants alike.
How It Works
- Step 1: Download the Excel file.
- Step 2: Review pre-entered I-Mab (IMAB) data (historical and projected).
- Step 3: Adjust key assumptions (yellow cells) based on your analysis.
- Step 4: View automatic recalculations for I-Mab’s intrinsic value.
- Step 5: Use the outputs for investment decisions or reporting.
Why Choose This Calculator for I-Mab (IMAB)?
- Accurate Data: Real I-Mab financials provide dependable valuation outcomes.
- Customizable: Tailor essential parameters like growth rates, WACC, and tax rates to fit your forecasts.
- Time-Saving: Pre-built calculations save you from starting from the ground up.
- Professional-Grade Tool: Crafted for investors, analysts, and consultants in the biotech sector.
- User-Friendly: Easy-to-navigate design and step-by-step guidance ensure accessibility for all users.
Who Should Use I-Mab (IMAB)?
- Investors: Gain insights and make informed decisions with a comprehensive analysis of I-Mab's pipeline and performance.
- Pharmaceutical Analysts: Streamline your evaluations with detailed reports on I-Mab's drug development progress.
- Consultants: Easily modify templates for presentations or strategic reports focused on I-Mab's market positioning.
- Healthcare Enthusiasts: Enhance your knowledge of biopharmaceutical trends through I-Mab's innovative therapies.
- Educators and Students: Utilize I-Mab's case studies as a practical resource in pharmaceutical and biotechnology courses.
What the Template Contains
- Historical Data: Includes I-Mab’s past financials and baseline forecasts.
- DCF and Levered DCF Models: Detailed templates to calculate I-Mab’s intrinsic value.
- WACC Sheet: Pre-built calculations for Weighted Average Cost of Capital.
- Editable Inputs: Modify key drivers like growth rates, EBITDA %, and CAPEX assumptions.
- Quarterly and Annual Statements: A complete breakdown of I-Mab’s financials.
- Interactive Dashboard: Visualize valuation results and projections dynamically.
Disclaimer
All information, articles, and product details provided on this website are for general informational and educational purposes only. We do not claim any ownership over, nor do we intend to infringe upon, any trademarks, copyrights, logos, brand names, or other intellectual property mentioned or depicted on this site. Such intellectual property remains the property of its respective owners, and any references here are made solely for identification or informational purposes, without implying any affiliation, endorsement, or partnership.
We make no representations or warranties, express or implied, regarding the accuracy, completeness, or suitability of any content or products presented. Nothing on this website should be construed as legal, tax, investment, financial, medical, or other professional advice. In addition, no part of this site—including articles or product references—constitutes a solicitation, recommendation, endorsement, advertisement, or offer to buy or sell any securities, franchises, or other financial instruments, particularly in jurisdictions where such activity would be unlawful.
All content is of a general nature and may not address the specific circumstances of any individual or entity. It is not a substitute for professional advice or services. Any actions you take based on the information provided here are strictly at your own risk. You accept full responsibility for any decisions or outcomes arising from your use of this website and agree to release us from any liability in connection with your use of, or reliance upon, the content or products found herein.