
|
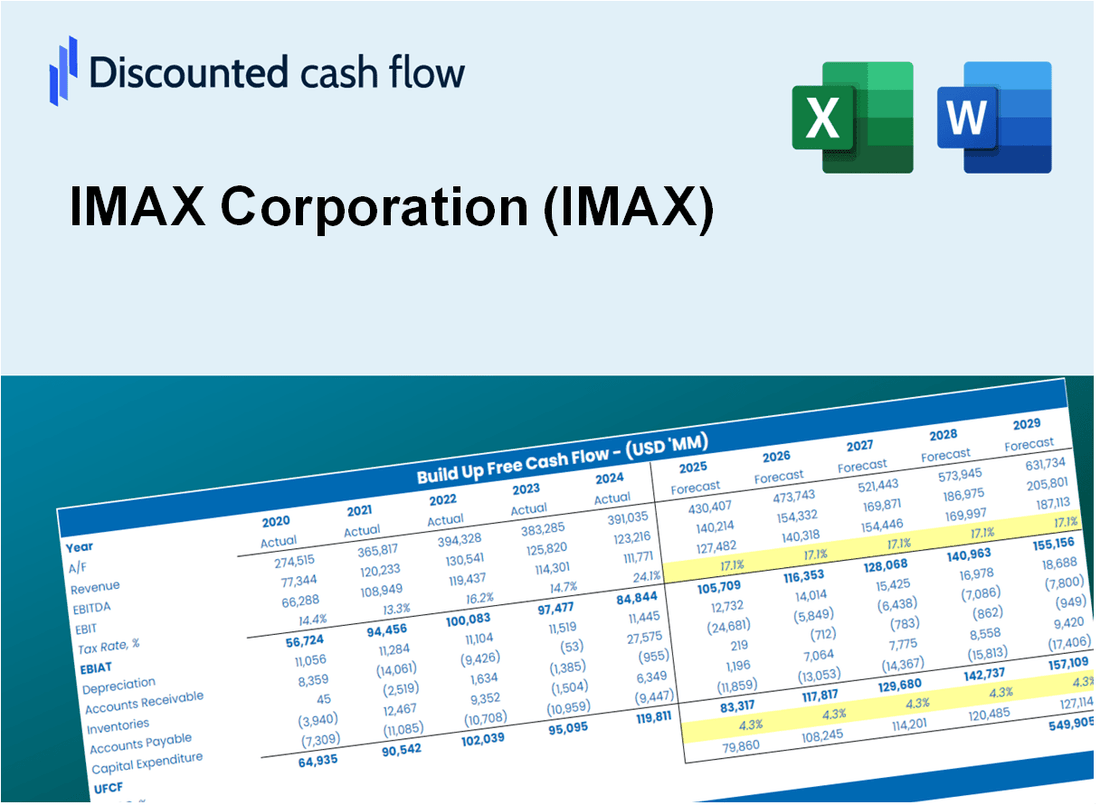
Valoración DCF de IMAX Corporation (IMAX) |
Completamente Editable: Adáptelo A Sus Necesidades En Excel O Sheets
Diseño Profesional: Plantillas Confiables Y Estándares De La Industria
Predeterminadas Para Un Uso Rápido Y Eficiente
Compatible con MAC / PC, completamente desbloqueado
No Se Necesita Experiencia; Fáciles De Seguir
IMAX Corporation (IMAX) Bundle
¡Agilice su análisis y mejore la precisión con nuestra calculadora IMAX DCF! Utilizando datos reales de IMAX y supuestos personalizables, esta herramienta le permite pronosticar, analizar y valorar IMAX Corporation (IMAX) como un inversor experimentado.
What You Will Receive
- Authentic IMAX Data: Preloaded financials – from revenue to EBIT – based on real and projected figures.
- Complete Customization: Modify all essential parameters (yellow cells) such as WACC, growth %, and tax rates.
- Immediate Valuation Updates: Automatic recalculations to assess the impact of changes on IMAX's fair value.
- Flexible Excel Template: Designed for quick edits, scenario analysis, and comprehensive projections.
- Efficient and Precise: Eliminate the need to build models from scratch while ensuring accuracy and adaptability.
Key Features
- Comprehensive DCF Calculator: Offers detailed unlevered and levered DCF valuation models tailored for IMAX Corporation (IMAX).
- WACC Calculator: Features a pre-built Weighted Average Cost of Capital sheet with adjustable inputs specific to IMAX Corporation (IMAX).
- Customizable Forecast Assumptions: Adjust growth rates, capital expenditures, and discount rates to fit IMAX Corporation (IMAX) projections.
- Integrated Financial Ratios: Evaluate profitability, leverage, and efficiency ratios relevant to IMAX Corporation (IMAX).
- Interactive Dashboard and Charts: Visual representations summarize essential valuation metrics for straightforward analysis of IMAX Corporation (IMAX).
How It Works
- Step 1: Download the prebuilt Excel template featuring IMAX Corporation's (IMAX) data.
- Step 2: Review the pre-filled sheets to grasp the essential metrics.
- Step 3: Modify forecasts and assumptions in the editable yellow cells (WACC, growth, margins).
- Step 4: Instantly see the recalculated results, including IMAX Corporation's (IMAX) intrinsic value.
- Step 5: Utilize the outputs to make informed investment decisions or create reports.
Why Choose This Calculator for IMAX Corporation (IMAX)?
- Designed for Experts: A sophisticated tool favored by financial analysts, CFOs, and industry consultants.
- Accurate Financial Data: IMAX's historical and projected financials are preloaded for precision.
- Versatile Scenario Analysis: Effortlessly simulate various forecasts and assumptions.
- Comprehensive Outputs: Instantly calculates intrinsic value, NPV, and essential financial metrics.
- User-Friendly Interface: Clear, step-by-step instructions facilitate a smooth experience.
Who Should Use This Product?
- Individual Investors: Make informed decisions about buying or selling IMAX stock.
- Financial Analysts: Streamline valuation processes with ready-to-use financial models for IMAX.
- Consultants: Deliver professional valuation insights on IMAX to clients quickly and accurately.
- Business Owners: Understand how major entertainment companies like IMAX are valued to guide your own strategy.
- Finance Students: Learn valuation techniques using real-world data and scenarios related to IMAX.
What the Template Contains
- Operating and Balance Sheet Data: Pre-filled IMAX Corporation (IMAX) historical data and forecasts, including revenue, EBITDA, EBIT, and capital expenditures.
- WACC Calculation: A dedicated sheet for Weighted Average Cost of Capital (WACC), including parameters like Beta, risk-free rate, and share price.
- DCF Valuation (Unlevered and Levered): Editable Discounted Cash Flow models showing intrinsic value with detailed calculations.
- Financial Statements: Pre-loaded financial statements (annual and quarterly) to support analysis.
- Key Ratios: Includes profitability, leverage, and efficiency ratios for IMAX Corporation (IMAX).
- Dashboard and Charts: Visual summary of valuation outputs and assumptions to analyze results easily.
Disclaimer
All information, articles, and product details provided on this website are for general informational and educational purposes only. We do not claim any ownership over, nor do we intend to infringe upon, any trademarks, copyrights, logos, brand names, or other intellectual property mentioned or depicted on this site. Such intellectual property remains the property of its respective owners, and any references here are made solely for identification or informational purposes, without implying any affiliation, endorsement, or partnership.
We make no representations or warranties, express or implied, regarding the accuracy, completeness, or suitability of any content or products presented. Nothing on this website should be construed as legal, tax, investment, financial, medical, or other professional advice. In addition, no part of this site—including articles or product references—constitutes a solicitation, recommendation, endorsement, advertisement, or offer to buy or sell any securities, franchises, or other financial instruments, particularly in jurisdictions where such activity would be unlawful.
All content is of a general nature and may not address the specific circumstances of any individual or entity. It is not a substitute for professional advice or services. Any actions you take based on the information provided here are strictly at your own risk. You accept full responsibility for any decisions or outcomes arising from your use of this website and agree to release us from any liability in connection with your use of, or reliance upon, the content or products found herein.