
|
Valoración de DCF de Imperial Brands PLC (IMB.L) |
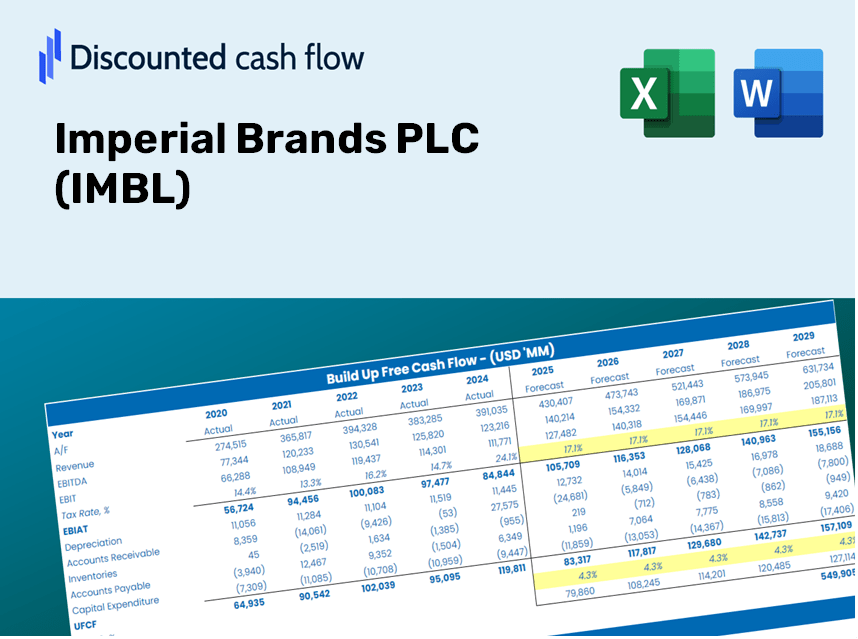
Completamente Editable: Adáptelo A Sus Necesidades En Excel O Sheets
Diseño Profesional: Plantillas Confiables Y Estándares De La Industria
Predeterminadas Para Un Uso Rápido Y Eficiente
Compatible con MAC / PC, completamente desbloqueado
No Se Necesita Experiencia; Fáciles De Seguir
Imperial Brands PLC (IMB.L) Bundle
¡Mejore sus estrategias de inversión con la calculadora DCF de Imperial Brands PLC (IMBL)! Utilice datos financieros auténticos de marcas imperiales, ajuste las proyecciones y gastos de crecimiento, y observe instantáneamente cómo estas modificaciones afectan el valor intrínseco de IMBL.
What You Will Receive
- Flexible Forecast Inputs: Effortlessly adjust key assumptions (growth %, profit margins, WACC) to explore various scenarios.
- Comprehensive Financial Data: Imperial Brands PLC’s financial information pre-loaded to kickstart your evaluation.
- Automated DCF Calculations: The template computes Net Present Value (NPV) and intrinsic value automatically.
- Tailored and Professional Design: A sleek Excel model that can be customized to fit your valuation requirements.
- Designed for Analysts and Investors: Perfect for analyzing projections, validating strategies, and optimizing your time.
Key Features
- Pre-Loaded Data: Imperial Brands PLC's historical financial statements and pre-filled forecasts.
- Fully Adjustable Inputs: Modify WACC, tax rates, revenue growth, and EBITDA margins to suit your analysis.
- Instant Results: View the intrinsic value of Imperial Brands PLC recalculating in real time.
- Clear Visual Outputs: Dashboard charts illustrate valuation results and key performance metrics.
- Built for Accuracy: A professional-grade tool designed for analysts, investors, and finance professionals.
How It Works
- Step 1: Download the prebuilt Excel template featuring Imperial Brands PLC’s (IMBL) data.
- Step 2: Navigate through the filled-out sheets to familiarize yourself with the essential metrics.
- Step 3: Modify projections and assumptions in the editable yellow cells (WACC, growth rates, margins).
- Step 4: Instantly access updated results, including the intrinsic value of Imperial Brands PLC (IMBL).
- Step 5: Use the outputs to make informed investment choices or create detailed reports.
Why Choose This Calculator for Imperial Brands PLC (IMBL)?
- Accuracy: Utilizes real Imperial Brands financials for precise data.
- Flexibility: Tailored for users to easily adjust and experiment with inputs.
- Time-Saving: Avoid the complexities of creating a DCF model from the ground up.
- Professional-Grade: Crafted with the precision and usability expected at the CFO level.
- User-Friendly: Simple to navigate, even for those new to financial modeling.
Who Should Consider This Product?
- Investors: Accurately assess the fair value of Imperial Brands PLC (IMBL) prior to making investment choices.
- CFOs: Utilize a professional-grade DCF model for comprehensive financial reporting and analysis related to Imperial Brands PLC (IMBL).
- Consultants: Swiftly modify the template for valuation reports tailored to clients interested in Imperial Brands PLC (IMBL).
- Entrepreneurs: Acquire knowledge of financial modeling techniques employed by leading firms, including Imperial Brands PLC (IMBL).
- Educators: Employ this as a teaching resource to illustrate various valuation methodologies relevant to Imperial Brands PLC (IMBL).
Overview of Template Features
- In-Depth DCF Model: Editable template providing comprehensive valuation calculations.
- Real-World Data: Imperial Brands PLC’s (IMBL) historical and projected financials included for thorough analysis.
- Customizable Parameters: Modify WACC, growth projections, and tax assumptions to explore various scenarios.
- Financial Statements: Detailed annual and quarterly reports for enhanced insights.
- Key Ratios: Integrated analysis for assessing profitability, efficiency, and leverage.
- Dashboard with Visual Outputs: Engaging charts and tables providing clear, actionable insights.
Disclaimer
All information, articles, and product details provided on this website are for general informational and educational purposes only. We do not claim any ownership over, nor do we intend to infringe upon, any trademarks, copyrights, logos, brand names, or other intellectual property mentioned or depicted on this site. Such intellectual property remains the property of its respective owners, and any references here are made solely for identification or informational purposes, without implying any affiliation, endorsement, or partnership.
We make no representations or warranties, express or implied, regarding the accuracy, completeness, or suitability of any content or products presented. Nothing on this website should be construed as legal, tax, investment, financial, medical, or other professional advice. In addition, no part of this site—including articles or product references—constitutes a solicitation, recommendation, endorsement, advertisement, or offer to buy or sell any securities, franchises, or other financial instruments, particularly in jurisdictions where such activity would be unlawful.
All content is of a general nature and may not address the specific circumstances of any individual or entity. It is not a substitute for professional advice or services. Any actions you take based on the information provided here are strictly at your own risk. You accept full responsibility for any decisions or outcomes arising from your use of this website and agree to release us from any liability in connection with your use of, or reliance upon, the content or products found herein.