
|
Indegene Limited (indgn.ns) valoración de DCF |
Completamente Editable: Adáptelo A Sus Necesidades En Excel O Sheets
Diseño Profesional: Plantillas Confiables Y Estándares De La Industria
Predeterminadas Para Un Uso Rápido Y Eficiente
Compatible con MAC / PC, completamente desbloqueado
No Se Necesita Experiencia; Fáciles De Seguir
Indegene Limited (INDGN.NS) Bundle
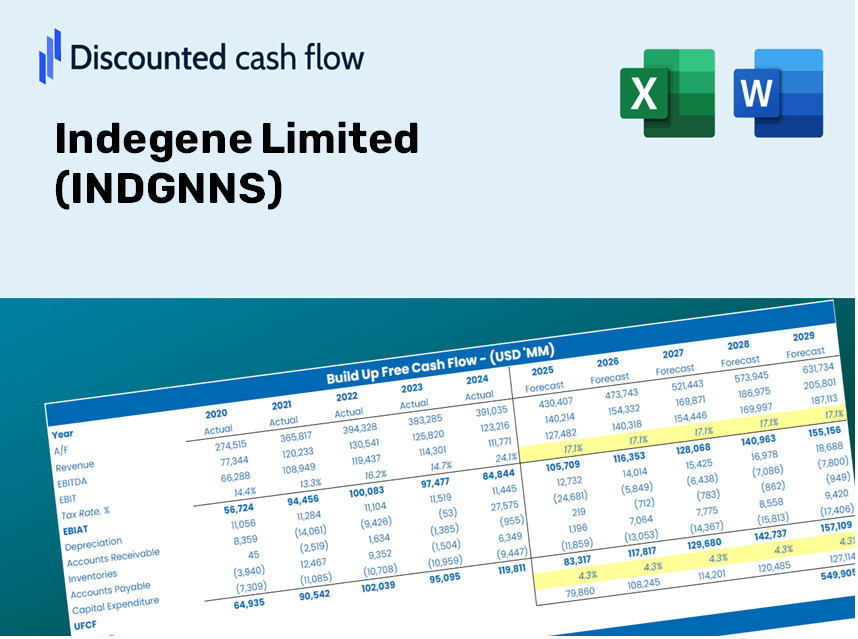
Diseñada para la precisión, nuestra calculadora DCF (indgnns) le permite evaluar la valoración de Indegene Limited utilizando datos financieros del mundo real al tiempo que proporciona flexibilidad completa para modificar todos los parámetros esenciales para mejorar las proyecciones.
Discounted Cash Flow (DCF) - (USD MM)
| Year | AY1 2021 |
AY2 2022 |
AY3 2023 |
AY4 2024 |
AY5 2025 |
FY1 2026 |
FY2 2027 |
FY3 2028 |
FY4 2029 |
FY5 2030 |
|---|---|---|---|---|---|---|---|---|---|---|
| Revenue | 9,662.7 | 16,646.1 | 23,061.3 | 25,896.0 | 28,393.0 | 37,815.5 | 50,365.0 | 67,079.1 | 89,340.1 | 118,988.5 |
| Revenue Growth, % | 0 | 72.27 | 38.54 | 12.29 | 9.64 | 33.19 | 33.19 | 33.19 | 33.19 | 33.19 |
| EBITDA | 2,641.7 | 2,659.1 | 4,541.9 | 5,841.0 | 5,343.0 | 7,894.5 | 10,514.3 | 14,003.6 | 18,650.9 | 24,840.4 |
| EBITDA, % | 27.34 | 15.97 | 19.69 | 22.56 | 18.82 | 20.88 | 20.88 | 20.88 | 20.88 | 20.88 |
| Depreciation | 255.5 | 334.5 | 598.1 | 761.0 | 802.0 | 984.0 | 1,310.5 | 1,745.4 | 2,324.7 | 3,096.1 |
| Depreciation, % | 2.64 | 2.01 | 2.59 | 2.94 | 2.82 | 2.6 | 2.6 | 2.6 | 2.6 | 2.6 |
| EBIT | 2,386.2 | 2,324.6 | 3,943.8 | 5,080.0 | 4,541.0 | 6,910.5 | 9,203.8 | 12,258.2 | 16,326.2 | 21,744.2 |
| EBIT, % | 24.69 | 13.96 | 17.1 | 19.62 | 15.99 | 18.27 | 18.27 | 18.27 | 18.27 | 18.27 |
| Total Cash | 1,334.7 | 6,262.8 | 7,113.4 | 9,851.0 | 16,643.0 | 13,533.4 | 18,024.5 | 24,006.2 | 31,972.9 | 42,583.4 |
| Total Cash, percent | .0 | .0 | .0 | .0 | .0 | .0 | .0 | .0 | .0 | .0 |
| Account Receivables | 2,854.0 | 4,439.1 | 6,636.0 | 6,480.0 | 7,514.0 | 10,321.1 | 13,746.2 | 18,308.1 | 24,383.8 | 32,475.8 |
| Account Receivables, % | 29.54 | 26.67 | 28.78 | 25.02 | 26.46 | 27.29 | 27.29 | 27.29 | 27.29 | 27.29 |
| Inventories | .0 | .0 | .0 | .0 | .0 | .0 | .0 | .0 | .0 | .0 |
| Inventories, % | 0 | 0 | 0 | 0 | 0 | 0 | 0 | 0 | 0 | 0 |
| Accounts Payable | 501.9 | 742.2 | 732.9 | 934.0 | 934.0 | 1,492.0 | 1,987.2 | 2,646.6 | 3,524.9 | 4,694.7 |
| Accounts Payable, % | 5.19 | 4.46 | 3.18 | 3.61 | 3.29 | 3.95 | 3.95 | 3.95 | 3.95 | 3.95 |
| Capital Expenditure | -206.2 | -247.1 | -188.3 | -107.0 | -300.0 | -446.6 | -594.8 | -792.1 | -1,055.0 | -1,405.1 |
| Capital Expenditure, % | -2.13 | -1.48 | -0.81669 | -0.41319 | -1.06 | -1.18 | -1.18 | -1.18 | -1.18 | -1.18 |
| Tax Rate, % | 24.59 | 24.59 | 24.59 | 24.59 | 24.59 | 24.59 | 24.59 | 24.59 | 24.59 | 24.59 |
| EBITAT | 1,540.2 | 1,691.0 | 2,890.6 | 3,729.7 | 3,424.5 | 4,967.5 | 6,616.1 | 8,811.7 | 11,735.9 | 15,630.6 |
| Depreciation | ||||||||||
| Changes in Account Receivables | ||||||||||
| Changes in Inventories | ||||||||||
| Changes in Accounts Payable | ||||||||||
| Capital Expenditure | ||||||||||
| UFCF | -762.5 | 433.6 | 1,094.2 | 4,740.8 | 2,892.5 | 3,255.9 | 4,401.8 | 5,862.6 | 7,808.2 | 10,399.4 |
| WACC, % | 11.13 | 11.15 | 11.15 | 11.15 | 11.15 | 11.15 | 11.15 | 11.15 | 11.15 | 11.15 |
| PV UFCF | ||||||||||
| SUM PV UFCF | 22,009.7 | |||||||||
| Long Term Growth Rate, % | 2.00 | |||||||||
| Free cash flow (T + 1) | 10,607 | |||||||||
| Terminal Value | 115,973 | |||||||||
| Present Terminal Value | 68,372 | |||||||||
| Enterprise Value | 90,382 | |||||||||
| Net Debt | -2,730 | |||||||||
| Equity Value | 93,112 | |||||||||
| Diluted Shares Outstanding, MM | 239 | |||||||||
| Equity Value Per Share | 389.66 |
What You Will Receive
- Customizable Excel Template: A fully editable Excel-based DCF Calculator featuring pre-populated financial data for Indegene Limited (INDGNNS).
- Authentic Data: Access to historical figures and future projections (highlighted in the yellow cells).
- Adjustable Forecasts: Modify assumptions such as revenue growth, EBITDA %, and WACC as needed.
- Instant Calculations: Quickly visualize how your inputs affect Indegene's valuation.
- Professional Resource: Designed for investors, CFOs, consultants, and financial analysts.
- Intuitive Layout: Organized for simplicity and ease of navigation, complete with step-by-step guidance.
Key Features
- Comprehensive DCF Calculator: Features extensive unlevered and levered DCF valuation models tailored for Indegene Limited (INDGNNS).
- WACC Calculator: Ready-to-use Weighted Average Cost of Capital sheet with customizable parameters for precise financial analysis.
- Modifiable Forecast Assumptions: Adjust predictions for growth rates, capital expenditures, and discount rates as needed.
- Integrated Financial Ratios: Evaluate profitability, leverage, and efficiency ratios specific to Indegene Limited (INDGNNS).
- Interactive Dashboard and Charts: Visual representations that highlight key valuation metrics for straightforward analysis.
How It Functions
- Step 1: Download the pre-designed Excel template featuring Indegene Limited's (INDGNNS) data.
- Step 2: Review the filled sheets and familiarize yourself with the critical metrics.
- Step 3: Adjust forecasts and assumptions in the editable yellow cells (WACC, growth, margins).
- Step 4: Instantly view updated results, including the intrinsic value of Indegene Limited (INDGNNS).
- Step 5: Make well-informed investment choices or create reports based on the results.
Why Choose This Calculator for Indegene Limited (INDGNNS)?
- Precision: Utilizes accurate Indegene financial data for reliable results.
- Versatility: Allows users to easily test and adjust inputs as needed.
- Efficiency: Eliminate the tedious process of constructing a DCF model from the ground up.
- Top-Tier Quality: Crafted with the expertise and functionality expected by CFOs.
- Intuitive Design: Simple to navigate, even for those with limited financial modeling skills.
Who Can Benefit from This Product?
- Investors: Assess Indegene Limited's (INDGNNS) valuation prior to making stock transactions.
- CFOs and Financial Analysts: Optimize valuation workflows and evaluate financial forecasts.
- Startup Founders: Gain insights into the valuation methods used for leading public companies like Indegene Limited.
- Consultants: Provide comprehensive valuation reports for your clientele.
- Students and Educators: Utilize real data to practice and instruct on valuation strategies.
Contents of the Template
- Comprehensive DCF Model: An editable template featuring intricate valuation calculations.
- Real-World Data: Indegene Limited’s (INDGNNS) historical and projected financials included for thorough analysis.
- Customizable Parameters: Modify WACC, growth rates, and tax assumptions to explore various scenarios.
- Financial Statements: Complete annual and quarterly breakdowns to provide deeper insights.
- Key Ratios: In-depth analysis for assessing profitability, efficiency, and leverage.
- Dashboard with Visual Outputs: Visuals such as charts and tables for clear, actionable insights.
Disclaimer
All information, articles, and product details provided on this website are for general informational and educational purposes only. We do not claim any ownership over, nor do we intend to infringe upon, any trademarks, copyrights, logos, brand names, or other intellectual property mentioned or depicted on this site. Such intellectual property remains the property of its respective owners, and any references here are made solely for identification or informational purposes, without implying any affiliation, endorsement, or partnership.
We make no representations or warranties, express or implied, regarding the accuracy, completeness, or suitability of any content or products presented. Nothing on this website should be construed as legal, tax, investment, financial, medical, or other professional advice. In addition, no part of this site—including articles or product references—constitutes a solicitation, recommendation, endorsement, advertisement, or offer to buy or sell any securities, franchises, or other financial instruments, particularly in jurisdictions where such activity would be unlawful.
All content is of a general nature and may not address the specific circumstances of any individual or entity. It is not a substitute for professional advice or services. Any actions you take based on the information provided here are strictly at your own risk. You accept full responsibility for any decisions or outcomes arising from your use of this website and agree to release us from any liability in connection with your use of, or reliance upon, the content or products found herein.