
|
Interglobe Aviation Limited (Indigo.NS) Valoración de DCF |
Completamente Editable: Adáptelo A Sus Necesidades En Excel O Sheets
Diseño Profesional: Plantillas Confiables Y Estándares De La Industria
Predeterminadas Para Un Uso Rápido Y Eficiente
Compatible con MAC / PC, completamente desbloqueado
No Se Necesita Experiencia; Fáciles De Seguir
InterGlobe Aviation Limited (INDIGO.NS) Bundle
¡Agilice su análisis y mejore la precisión con nuestra calculadora DCF (indigons)! Equipado con datos limitados de Interglobe Aviation Real y suposiciones personalizables, esta herramienta le permite pronosticar, analizar y valorar la aviación interglobe como un inversor experimentado.
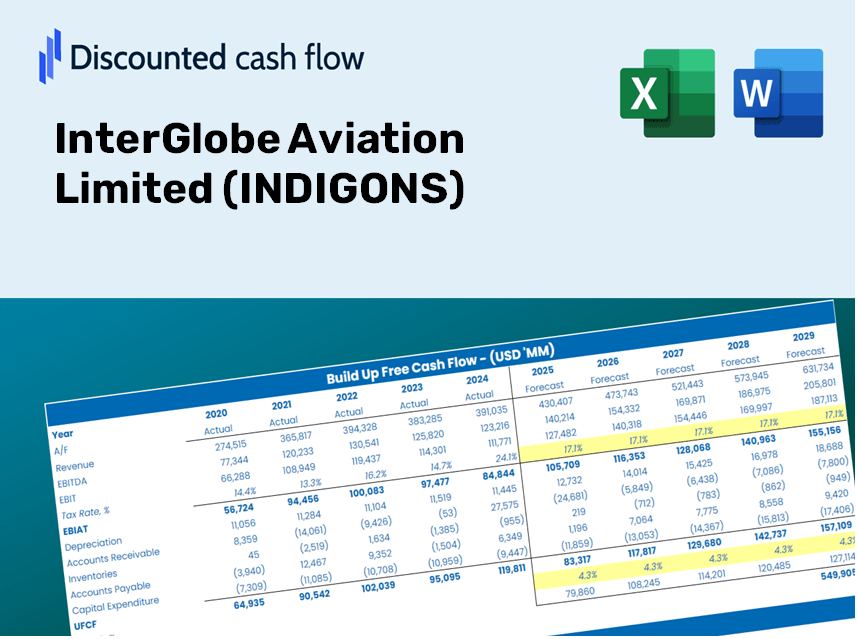
Discounted Cash Flow (DCF) - (USD MM)
| Year | AY1 2021 |
AY2 2022 |
AY3 2023 |
AY4 2024 |
AY5 2025 |
FY1 2026 |
FY2 2027 |
FY3 2028 |
FY4 2029 |
FY5 2030 |
|---|---|---|---|---|---|---|---|---|---|---|
| Revenue | 145,415.8 | 256,724.4 | 536,076.7 | 673,868.7 | 804,960.0 | 1,251,114.0 | 1,944,551.5 | 3,022,330.9 | 4,697,476.1 | 7,301,080.7 |
| Revenue Growth, % | 0 | 76.55 | 108.81 | 25.7 | 19.45 | 55.43 | 55.43 | 55.43 | 55.43 | 55.43 |
| EBITDA | 6,094.7 | 9,508.0 | 75,251.7 | 180,414.3 | 204,479.0 | 185,434.2 | 288,212.2 | 447,955.5 | 696,237.6 | 1,082,131.5 |
| EBITDA, % | 4.19 | 3.7 | 14.04 | 26.77 | 25.4 | 14.82 | 14.82 | 14.82 | 14.82 | 14.82 |
| Depreciation | 46,994.5 | 50,686.0 | 51,029.7 | 64,257.3 | 86,802.0 | 204,929.3 | 318,512.6 | 495,050.1 | 769,434.7 | 1,195,898.5 |
| Depreciation, % | 32.32 | 19.74 | 9.52 | 9.54 | 10.78 | 16.38 | 16.38 | 16.38 | 16.38 | 16.38 |
| EBIT | -40,899.7 | -41,178.0 | 24,222.0 | 116,157.0 | 117,677.0 | -19,495.1 | -30,300.4 | -47,094.6 | -73,197.1 | -113,767.0 |
| EBIT, % | -28.13 | -16.04 | 4.52 | 17.24 | 14.62 | -1.56 | -1.56 | -1.56 | -1.56 | -1.56 |
| Total Cash | 91,278.8 | 79,457.9 | 141,795.0 | 212,230.3 | 333,069.0 | 483,038.7 | 750,765.8 | 1,166,882.4 | 1,813,634.0 | 2,818,851.6 |
| Total Cash, percent | .0 | .0 | .0 | .0 | .0 | .0 | .0 | .0 | .0 | .0 |
| Account Receivables | 7,146.3 | 3,329.2 | 7,778.0 | 11,715.4 | 13,195.0 | 27,624.2 | 42,935.0 | 66,732.0 | 103,718.6 | 161,205.3 |
| Account Receivables, % | 4.91 | 1.3 | 1.45 | 1.74 | 1.64 | 2.21 | 2.21 | 2.21 | 2.21 | 2.21 |
| Inventories | 3,164.2 | 4,080.6 | 5,910.7 | 6,248.0 | 8,203.0 | 17,050.9 | 26,501.4 | 41,190.0 | 64,019.7 | 99,503.1 |
| Inventories, % | 2.18 | 1.59 | 1.1 | 0.92718 | 1.02 | 1.36 | 1.36 | 1.36 | 1.36 | 1.36 |
| Accounts Payable | 15,513.3 | 31,518.2 | 32,089.9 | 31,576.2 | 41,756.0 | 97,097.7 | 150,914.7 | 234,560.0 | 364,566.3 | 566,629.4 |
| Accounts Payable, % | 10.67 | 12.28 | 5.99 | 4.69 | 5.19 | 7.76 | 7.76 | 7.76 | 7.76 | 7.76 |
| Capital Expenditure | -4,368.9 | -3,468.8 | -5,698.0 | -11,026.5 | -24,145.0 | -25,158.2 | -39,102.3 | -60,774.9 | -94,459.8 | -146,814.7 |
| Capital Expenditure, % | -3 | -1.35 | -1.06 | -1.64 | -3 | -2.01 | -2.01 | -2.01 | -2.01 | -2.01 |
| Tax Rate, % | 4.41 | 4.41 | 4.41 | 4.41 | 4.41 | 4.41 | 4.41 | 4.41 | 4.41 | 4.41 |
| EBITAT | -40,817.9 | -41,232.6 | 24,333.7 | 117,934.3 | 112,485.4 | -19,315.3 | -30,020.9 | -46,660.2 | -72,522.0 | -112,717.7 |
| Depreciation | ||||||||||
| Changes in Account Receivables | ||||||||||
| Changes in Inventories | ||||||||||
| Changes in Accounts Payable | ||||||||||
| Capital Expenditure | ||||||||||
| UFCF | 7,010.6 | 24,890.1 | 63,958.2 | 166,376.7 | 181,887.6 | 192,520.5 | 278,445.0 | 432,774.8 | 672,642.9 | 1,045,459.2 |
| WACC, % | 7.67 | 7.67 | 7.67 | 7.67 | 7.59 | 7.65 | 7.65 | 7.65 | 7.65 | 7.65 |
| PV UFCF | ||||||||||
| SUM PV UFCF | 1,989,847.6 | |||||||||
| Long Term Growth Rate, % | 3.00 | |||||||||
| Free cash flow (T + 1) | 1,076,823 | |||||||||
| Terminal Value | 23,141,475 | |||||||||
| Present Terminal Value | 16,005,011 | |||||||||
| Enterprise Value | 17,994,859 | |||||||||
| Net Debt | 478,469 | |||||||||
| Equity Value | 17,516,390 | |||||||||
| Diluted Shares Outstanding, MM | 387 | |||||||||
| Equity Value Per Share | 45,289.61 |
What You Will Receive
- Authentic INDIGONS Financial Data: Pre-loaded with InterGlobe Aviation Limited’s historical and forecasted data for accurate analysis.
- Completely Customizable Template: Effortlessly adjust key metrics such as revenue growth, WACC, and EBITDA percentage.
- Instant Calculations: Observe the intrinsic value of INDIGONS update in real-time as you modify inputs.
- Professional Valuation Tool: Tailored for investors, analysts, and consultants focused on obtaining precise DCF results.
- User-Friendly Interface: Intuitive layout and straightforward guidance suitable for users of all experience levels.
Key Features
- Accurate Financial Data for InterGlobe Aviation Limited: Gain access to reliable historical data and future forecasts.
- Tailorable Forecast Parameters: Modify highlighted cells to adjust WACC, growth rates, and profit margins.
- Real-Time Calculations: Automatic updates for DCF, Net Present Value (NPV), and cash flow assessments.
- User-Friendly Visual Dashboard: Intuitive charts and summaries that present your valuation findings clearly.
- Suitable for All Skill Levels: Designed with simplicity for investors, CFOs, and consultants alike.
How It Functions
- Download: Obtain the pre-formatted Excel file featuring InterGlobe Aviation Limited's (INDIGONS) financial data.
- Customize: Modify forecasts such as revenue growth, EBITDA %, and WACC as per your requirements.
- Update Automatically: The intrinsic value and NPV calculations refresh in real-time.
- Test Scenarios: Develop various projections and instantly compare the outcomes.
- Make Decisions: Leverage the valuation results to inform your investment strategy.
Why Opt for This Calculator?
- Designed for Industry Experts: A specialized tool utilized by analysts, CFOs, and consultants in the aviation sector.
- Accurate Financial Data: InterGlobe Aviation Limited's (INDIGONS) historical and projected financials are preloaded for precision.
- Flexible Scenario Analysis: Effortlessly simulate various forecasts and scenarios to inform your decisions.
- Comprehensive Outputs: Automatically calculates intrinsic value, NPV, and other critical metrics.
- User-Friendly: Step-by-step guidance ensures a smooth experience throughout the calculation process.
Who Should Use This Product?
- Finance Students: Acquire valuation techniques and apply them to real-world data.
- Academics: Integrate industry-standard models into your courses or research projects.
- Investors: Validate your assumptions and evaluate valuation outcomes for InterGlobe Aviation Limited (INDIGONS) stock.
- Analysts: Optimize your workflow with a ready-made, customizable DCF model.
- Small Business Owners: Understand how major public companies like InterGlobe Aviation Limited (INDIGONS) are analyzed.
Contents of the Template
- In-Depth DCF Model: An editable template featuring comprehensive valuation calculations.
- Real-Time Data: Historical and projected financials for InterGlobe Aviation Limited (INDIGONS) preloaded for your analysis.
- Adjustable Parameters: Modify WACC, growth rates, and tax assumptions to explore different scenarios.
- Financial Statements: Complete annual and quarterly financial breakdowns for enhanced insight.
- Key Financial Ratios: Integrated analysis for evaluating profitability, efficiency, and leverage.
- Visual Dashboard: Charts and tables that provide clear, actionable insights.
Disclaimer
All information, articles, and product details provided on this website are for general informational and educational purposes only. We do not claim any ownership over, nor do we intend to infringe upon, any trademarks, copyrights, logos, brand names, or other intellectual property mentioned or depicted on this site. Such intellectual property remains the property of its respective owners, and any references here are made solely for identification or informational purposes, without implying any affiliation, endorsement, or partnership.
We make no representations or warranties, express or implied, regarding the accuracy, completeness, or suitability of any content or products presented. Nothing on this website should be construed as legal, tax, investment, financial, medical, or other professional advice. In addition, no part of this site—including articles or product references—constitutes a solicitation, recommendation, endorsement, advertisement, or offer to buy or sell any securities, franchises, or other financial instruments, particularly in jurisdictions where such activity would be unlawful.
All content is of a general nature and may not address the specific circumstances of any individual or entity. It is not a substitute for professional advice or services. Any actions you take based on the information provided here are strictly at your own risk. You accept full responsibility for any decisions or outcomes arising from your use of this website and agree to release us from any liability in connection with your use of, or reliance upon, the content or products found herein.