
|
Valoración DCF de Indonesia Energy Corporation Limited (INDO) |
Completamente Editable: Adáptelo A Sus Necesidades En Excel O Sheets
Diseño Profesional: Plantillas Confiables Y Estándares De La Industria
Predeterminadas Para Un Uso Rápido Y Eficiente
Compatible con MAC / PC, completamente desbloqueado
No Se Necesita Experiencia; Fáciles De Seguir
Indonesia Energy Corporation Limited (INDO) Bundle
Ya sea que sea un inversor o analista, esta calculadora (indo) DCF es su herramienta de referencia para una valoración precisa. Con datos reales de Indonesia Energy Corporation Limited, puede ajustar las previsiones y observar los efectos en tiempo real.
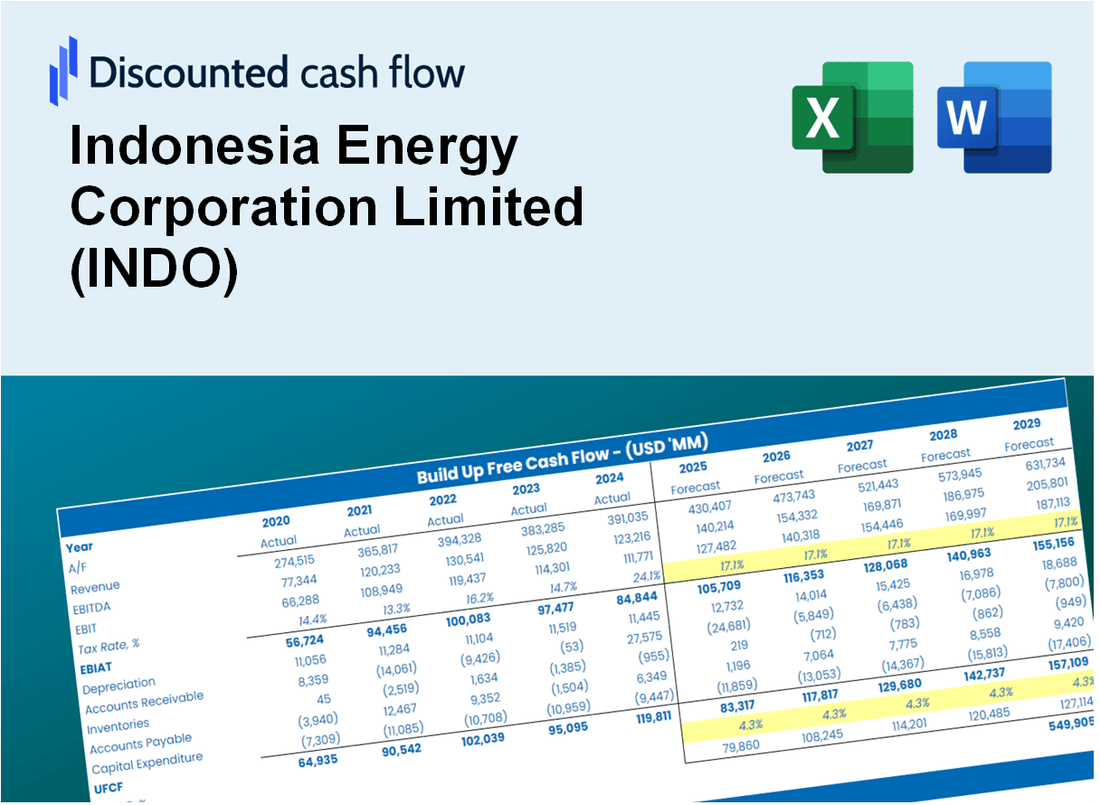
Discounted Cash Flow (DCF) - (USD MM)
| Year | AY1 2020 |
AY2 2021 |
AY3 2022 |
AY4 2023 |
AY5 2024 |
FY1 2025 |
FY2 2026 |
FY3 2027 |
FY4 2028 |
FY5 2029 |
|---|---|---|---|---|---|---|---|---|---|---|
| Revenue | 2.0 | 2.5 | 4.1 | 3.5 | 2.7 | 3.0 | 3.4 | 3.9 | 4.4 | 4.9 |
| Revenue Growth, % | 0 | 23.82 | 67.07 | -13.96 | -24.34 | 13.15 | 13.15 | 13.15 | 13.15 | 13.15 |
| EBITDA | -6.6 | -5.3 | -3.5 | -2.4 | -4.5 | -2.7 | -3.1 | -3.5 | -4.0 | -4.5 |
| EBITDA, % | -331.73 | -215.72 | -84.41 | -67.52 | -169.79 | -90.38 | -90.38 | -90.38 | -90.38 | -90.38 |
| Depreciation | .7 | .8 | 1.1 | 1.2 | 1.5 | 1.1 | 1.3 | 1.4 | 1.6 | 1.8 |
| Depreciation, % | 35.28 | 33.06 | 27.82 | 33.33 | 54.8 | 36.86 | 36.86 | 36.86 | 36.86 | 36.86 |
| EBIT | -7.3 | -6.1 | -4.6 | -3.6 | -6.0 | -3.0 | -3.4 | -3.9 | -4.4 | -4.9 |
| EBIT, % | -367.01 | -248.78 | -112.22 | -100.85 | -224.58 | -100 | -100 | -100 | -100 | -100 |
| Total Cash | 6.9 | .6 | 5.9 | 2.0 | 4.6 | 2.3 | 2.6 | 2.9 | 3.3 | 3.8 |
| Total Cash, percent | .0 | .0 | .0 | .0 | .0 | .0 | .0 | .0 | .0 | .0 |
| Account Receivables | 1.1 | 1.0 | .7 | .9 | .9 | 1.0 | 1.2 | 1.3 | 1.5 | 1.7 |
| Account Receivables, % | 57.15 | 41.05 | 15.99 | 25.25 | 33.53 | 34.59 | 34.59 | 34.59 | 34.59 | 34.59 |
| Inventories | .3 | .1 | .1 | .1 | .2 | .2 | .2 | .3 | .3 | .3 |
| Inventories, % | 14.97 | 5.57 | 2.97 | 4.21 | 7.14 | 6.97 | 6.97 | 6.97 | 6.97 | 6.97 |
| Accounts Payable | .3 | 1.6 | .7 | .8 | .9 | .9 | 1.0 | 1.2 | 1.3 | 1.5 |
| Accounts Payable, % | 15 | 65.41 | 17.55 | 21.38 | 33.73 | 30.61 | 30.61 | 30.61 | 30.61 | 30.61 |
| Capital Expenditure | -.4 | -.3 | .0 | -.4 | -2.8 | -.9 | -1.0 | -1.1 | -1.2 | -1.4 |
| Capital Expenditure, % | -18.04 | -12.7 | -0.0410992 | -11.9 | -105.76 | -28.54 | -28.54 | -28.54 | -28.54 | -28.54 |
| Tax Rate, % | 0 | 0 | 0 | 0 | 0 | 0 | 0 | 0 | 0 | 0 |
| EBITAT | -7.3 | -6.1 | -4.6 | -3.6 | -6.0 | -3.0 | -3.4 | -3.9 | -4.4 | -4.9 |
| Depreciation | ||||||||||
| Changes in Account Receivables | ||||||||||
| Changes in Inventories | ||||||||||
| Changes in Accounts Payable | ||||||||||
| Capital Expenditure | ||||||||||
| UFCF | -8.1 | -4.0 | -4.0 | -3.0 | -7.3 | -2.9 | -3.2 | -3.6 | -4.1 | -4.6 |
| WACC, % | 4.63 | 4.63 | 4.63 | 4.63 | 4.63 | 4.63 | 4.63 | 4.63 | 4.63 | 4.63 |
| PV UFCF | ||||||||||
| SUM PV UFCF | -15.9 | |||||||||
| Long Term Growth Rate, % | 2.00 | |||||||||
| Free cash flow (T + 1) | -5 | |||||||||
| Terminal Value | -178 | |||||||||
| Present Terminal Value | -142 | |||||||||
| Enterprise Value | -158 | |||||||||
| Net Debt | -4 | |||||||||
| Equity Value | -154 | |||||||||
| Diluted Shares Outstanding, MM | 10 | |||||||||
| Equity Value Per Share | -15.23 |
What You Will Get
- Real INDO Financials: Access to historical and projected data for precise valuation.
- Customizable Inputs: Adjust WACC, tax rates, revenue growth, and capital expenditures as needed.
- Dynamic Calculations: Intrinsic value and NPV are computed automatically in real-time.
- Scenario Analysis: Explore various scenarios to assess Indonesia Energy Corporation's future performance.
- User-Friendly Design: Tailored for professionals while remaining easy to navigate for newcomers.
Key Features
- Comprehensive Financial Data: Gain access to precise pre-loaded historical data and future forecasts for Indonesia Energy Corporation Limited (INDO).
- Adjustable Forecast Parameters: Modify editable fields highlighted in yellow, including WACC, growth rates, and margins.
- Real-Time Calculations: Automatic recalculations for DCF, Net Present Value (NPV), and cash flow assessments.
- User-Friendly Dashboard: Clear and concise charts and summaries to help visualize your valuation outcomes.
- Designed for All Users: An intuitive layout suitable for investors, CFOs, and consultants, regardless of experience level.
How It Works
- Step 1: Download the prebuilt Excel template featuring Indonesia Energy Corporation Limited’s (INDO) data.
- Step 2: Navigate through the pre-filled sheets to familiarize yourself with the essential metrics.
- Step 3: Modify forecasts and assumptions in the editable yellow cells (WACC, growth, margins).
- Step 4: Instantly see the recalculated results, including Indonesia Energy Corporation Limited’s (INDO) intrinsic value.
- Step 5: Make well-informed investment decisions or create reports based on the outputs.
Why Choose This Calculator for Indonesia Energy Corporation Limited (INDO)?
- Accuracy: Utilizes real financial data from Indonesia Energy Corporation for precise calculations.
- Flexibility: Allows users to easily adjust and experiment with various input parameters.
- Time-Saving: Eliminate the need to create a DCF model from the ground up.
- Professional-Grade: Crafted with the expertise and standards expected at the CFO level.
- User-Friendly: Intuitive design ensures accessibility for users with varying levels of financial knowledge.
Who Should Use This Product?
- Professional Investors: Develop comprehensive and precise valuation models for portfolio assessments related to Indonesia Energy Corporation Limited (INDO).
- Corporate Finance Teams: Evaluate valuation scenarios to inform strategic decisions within their organizations.
- Consultants and Advisors: Deliver clients accurate valuation insights for Indonesia Energy Corporation Limited (INDO) stock.
- Students and Educators: Utilize real-world data to enhance learning and practice in financial modeling.
- Energy Sector Enthusiasts: Gain insights into how energy companies like Indonesia Energy Corporation Limited (INDO) are valued in the market.
What the Template Contains
- Pre-Filled Data: Includes Indonesia Energy Corporation Limited’s (INDO) historical financials and forecasts.
- Discounted Cash Flow Model: Editable DCF valuation model with automatic calculations.
- Weighted Average Cost of Capital (WACC): A dedicated sheet for calculating WACC based on custom inputs.
- Key Financial Ratios: Analyze Indonesia Energy Corporation Limited’s (INDO) profitability, efficiency, and leverage.
- Customizable Inputs: Edit revenue growth, margins, and tax rates with ease.
- Clear Dashboard: Charts and tables summarizing key valuation results.
Disclaimer
All information, articles, and product details provided on this website are for general informational and educational purposes only. We do not claim any ownership over, nor do we intend to infringe upon, any trademarks, copyrights, logos, brand names, or other intellectual property mentioned or depicted on this site. Such intellectual property remains the property of its respective owners, and any references here are made solely for identification or informational purposes, without implying any affiliation, endorsement, or partnership.
We make no representations or warranties, express or implied, regarding the accuracy, completeness, or suitability of any content or products presented. Nothing on this website should be construed as legal, tax, investment, financial, medical, or other professional advice. In addition, no part of this site—including articles or product references—constitutes a solicitation, recommendation, endorsement, advertisement, or offer to buy or sell any securities, franchises, or other financial instruments, particularly in jurisdictions where such activity would be unlawful.
All content is of a general nature and may not address the specific circumstances of any individual or entity. It is not a substitute for professional advice or services. Any actions you take based on the information provided here are strictly at your own risk. You accept full responsibility for any decisions or outcomes arising from your use of this website and agree to release us from any liability in connection with your use of, or reliance upon, the content or products found herein.