
|
Indus Towers Limited (indhous.ns) Valoración de DCF |
Completamente Editable: Adáptelo A Sus Necesidades En Excel O Sheets
Diseño Profesional: Plantillas Confiables Y Estándares De La Industria
Predeterminadas Para Un Uso Rápido Y Eficiente
Compatible con MAC / PC, completamente desbloqueado
No Se Necesita Experiencia; Fáciles De Seguir
Indus Towers Limited (INDUSTOWER.NS) Bundle
¡Evalúe las perspectivas financieras de Indus Towers Limited como un experto! Esta calculadora DCF (Industarns) viene con finanzas pre-llenas y ofrece una flexibilidad total para modificar el crecimiento de los ingresos, WACC, los márgenes y otros supuestos cruciales para alinearse con sus proyecciones.
What You Will Receive
- Pre-Filled Financial Model: Leveraging Indus Towers Limited’s actual data for accurate DCF valuation.
- Complete Forecast Control: Modify revenue growth, margins, WACC, and various crucial drivers.
- Real-Time Calculations: Automatic updates ensure you see immediate results as you adjust inputs.
- Professional-Grade Template: A polished Excel file specifically designed for high-quality valuation.
- Customizable and Reusable: Crafted for adaptability, enabling repeated application for in-depth forecasts.
Key Features
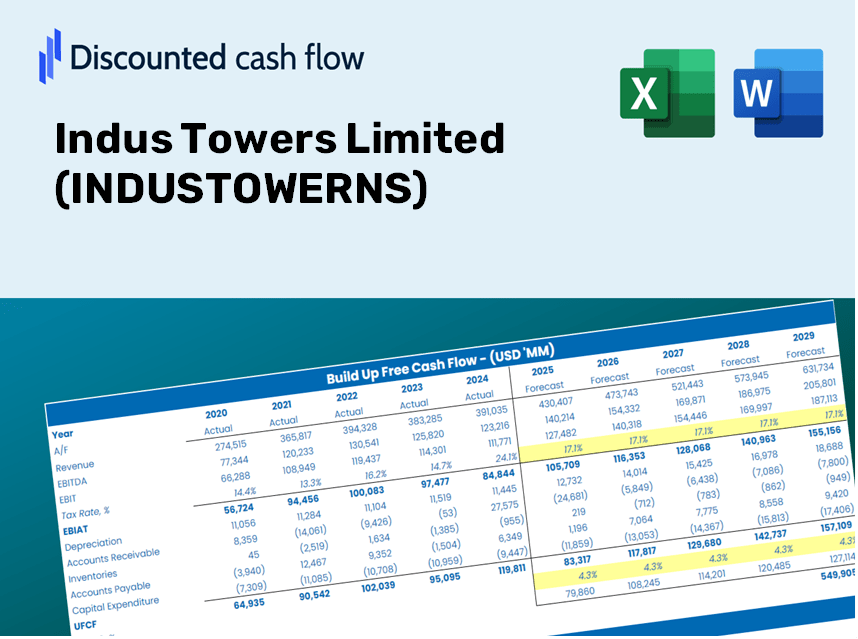
- Real-Life INDUSTOWERNS Data: Pre-filled with Indus Towers Limited's historical financials and future projections.
- Fully Customizable Inputs: Modify revenue growth, operating margins, WACC, tax rates, and capital expenditures to fit your analysis.
- Dynamic Valuation Model: Automatic recalculations of Net Present Value (NPV) and intrinsic value based on your customized inputs.
- Scenario Testing: Develop various forecasting scenarios to explore different valuation possibilities.
- User-Friendly Design: Intuitive, organized, and crafted for both professionals and newcomers.
How It Operates
- 1. Access the Template: Download and open the Excel document containing Indus Towers Limited’s (INDUSTOWERNS) preloaded data.
- 2. Modify Assumptions: Adjust crucial inputs such as growth rates, WACC, and capital expenditures as needed.
- 3. View Results Immediately: The DCF model automatically computes the intrinsic value and NPV in real time.
- 4. Explore Scenarios: Analyze various forecasts to evaluate different valuation scenarios.
- 5. Present with Confidence: Share professional valuation insights to support your decision-making process.
Why Use Indus Towers Limited (INDUSTOWERNS) Calculator?
- Save Time: Skip the hassle of building a DCF model from the ground up – our tool is ready for immediate use.
- Enhance Accuracy: Dependable financial data and formulas help minimize valuation errors.
- Completely Customizable: Modify the model to suit your unique assumptions and forecasts.
- Simple to Understand: Intuitive charts and outputs facilitate easy result analysis.
- Endorsed by Professionals: Crafted for experts who prioritize precision and ease of use.
Who Can Benefit from Indus Towers Limited (INDUSTOWERNS)?
- Individual Investors: Gain insights to make informed choices regarding buying or selling Indus Towers Limited (INDUSTOWERNS) shares.
- Financial Analysts: Enhance your valuation processes with ready-to-use financial models tailored for Indus Towers Limited (INDUSTOWERNS).
- Consultants: Provide clients with accurate and timely valuation insights on Indus Towers Limited (INDUSTOWERNS).
- Business Owners: Learn from the valuation strategies of large telecom companies like Indus Towers Limited (INDUSTOWERNS) to inform your own business strategy.
- Finance Students: Acquire practical knowledge of valuation techniques through real-world data and examples involving Indus Towers Limited (INDUSTOWERNS).
Contents of the Template
- Pre-Filled DCF Model: Indus Towers Limited’s (INDUSTOWERNS) financial data ready for immediate implementation.
- WACC Calculator: Comprehensive calculations for the Weighted Average Cost of Capital.
- Financial Ratios: Assess Indus Towers Limited’s profitability, leverage, and operational efficiency.
- Editable Inputs: Modify assumptions such as growth rates, margins, and capital expenditure to suit your analysis.
- Financial Statements: Annual and quarterly reports to facilitate in-depth analysis.
- Interactive Dashboard: Effortlessly visualize critical valuation metrics and results.
Disclaimer
All information, articles, and product details provided on this website are for general informational and educational purposes only. We do not claim any ownership over, nor do we intend to infringe upon, any trademarks, copyrights, logos, brand names, or other intellectual property mentioned or depicted on this site. Such intellectual property remains the property of its respective owners, and any references here are made solely for identification or informational purposes, without implying any affiliation, endorsement, or partnership.
We make no representations or warranties, express or implied, regarding the accuracy, completeness, or suitability of any content or products presented. Nothing on this website should be construed as legal, tax, investment, financial, medical, or other professional advice. In addition, no part of this site—including articles or product references—constitutes a solicitation, recommendation, endorsement, advertisement, or offer to buy or sell any securities, franchises, or other financial instruments, particularly in jurisdictions where such activity would be unlawful.
All content is of a general nature and may not address the specific circumstances of any individual or entity. It is not a substitute for professional advice or services. Any actions you take based on the information provided here are strictly at your own risk. You accept full responsibility for any decisions or outcomes arising from your use of this website and agree to release us from any liability in connection with your use of, or reliance upon, the content or products found herein.