
|
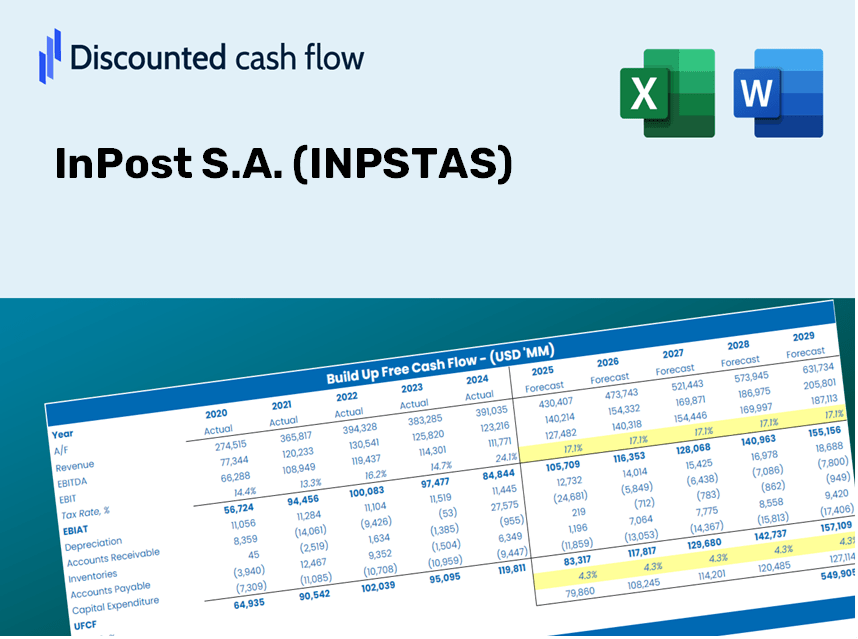
Inpost S.A. (Inpst.as) Valoración de DCF |
Completamente Editable: Adáptelo A Sus Necesidades En Excel O Sheets
Diseño Profesional: Plantillas Confiables Y Estándares De La Industria
Predeterminadas Para Un Uso Rápido Y Eficiente
Compatible con MAC / PC, completamente desbloqueado
No Se Necesita Experiencia; Fáciles De Seguir
InPost S.A. (INPST.AS) Bundle
¡Evalúe las perspectivas financieras de Inpost S.A. como un experto! Esta calculadora DCF (INPSTAS) le proporciona datos financieros previamente llenos y flexibilidad total para modificar el crecimiento de los ingresos, WACC, los márgenes y otros supuestos críticos para alinearse con sus predicciones.
Discounted Cash Flow (DCF) - (USD MM)
| Year | AY1 2020 |
AY2 2021 |
AY3 2022 |
AY4 2023 |
AY5 2024 |
FY1 2025 |
FY2 2026 |
FY3 2027 |
FY4 2028 |
FY5 2029 |
|---|---|---|---|---|---|---|---|---|---|---|
| Revenue | 589.6 | 1,072.9 | 1,653.3 | 2,070.9 | 2,557.1 | 3,738.5 | 5,465.7 | 7,991.0 | 11,682.9 | 17,080.6 |
| Revenue Growth, % | 0 | 81.98 | 54.09 | 25.26 | 23.48 | 46.2 | 46.2 | 46.2 | 46.2 | 46.2 |
| EBITDA | 172.2 | 248.5 | 452.9 | 573.9 | 817.0 | 1,042.4 | 1,524.1 | 2,228.2 | 3,257.7 | 4,762.8 |
| EBITDA, % | 29.2 | 23.16 | 27.39 | 27.71 | 31.95 | 27.88 | 27.88 | 27.88 | 27.88 | 27.88 |
| Depreciation | 83.4 | 142.8 | 227.7 | 269.1 | 349.0 | 507.4 | 741.8 | 1,084.6 | 1,585.7 | 2,318.2 |
| Depreciation, % | 14.14 | 13.31 | 13.77 | 12.99 | 13.65 | 13.57 | 13.57 | 13.57 | 13.57 | 13.57 |
| EBIT | 88.8 | 105.8 | 225.2 | 304.8 | 468.1 | 535.0 | 782.2 | 1,143.7 | 1,672.0 | 2,444.6 |
| EBIT, % | 15.06 | 9.86 | 13.62 | 14.72 | 18.3 | 14.31 | 14.31 | 14.31 | 14.31 | 14.31 |
| Total Cash | 32.6 | 114.8 | 101.3 | 132.9 | 182.8 | 268.6 | 392.7 | 574.1 | 839.4 | 1,227.2 |
| Total Cash, percent | .0 | .0 | .0 | .0 | .0 | .0 | .0 | .0 | .0 | .0 |
| Account Receivables | 95.4 | 187.2 | 249.8 | 284.6 | 469.9 | 604.6 | 883.9 | 1,292.3 | 1,889.4 | 2,762.3 |
| Account Receivables, % | 16.19 | 17.44 | 15.11 | 13.74 | 18.37 | 16.17 | 16.17 | 16.17 | 16.17 | 16.17 |
| Inventories | 1.3 | 2.6 | 3.4 | 3.0 | 2.8 | 6.9 | 10.1 | 14.8 | 21.6 | 31.6 |
| Inventories, % | 0.22639 | 0.23789 | 0.20396 | 0.147 | 0.10989 | 0.18503 | 0.18503 | 0.18503 | 0.18503 | 0.18503 |
| Accounts Payable | 58.0 | 154.2 | 201.7 | 218.2 | 351.5 | 453.8 | 663.4 | 969.9 | 1,418.1 | 2,073.2 |
| Accounts Payable, % | 9.84 | 14.37 | 12.2 | 10.54 | 13.75 | 12.14 | 12.14 | 12.14 | 12.14 | 12.14 |
| Capital Expenditure | -125.6 | -219.1 | -261.3 | -238.8 | -327.8 | -612.2 | -895.1 | -1,308.6 | -1,913.2 | -2,797.1 |
| Capital Expenditure, % | -21.31 | -20.42 | -15.8 | -11.53 | -12.82 | -16.38 | -16.38 | -16.38 | -16.38 | -16.38 |
| Tax Rate, % | 23.61 | 23.61 | 23.61 | 23.61 | 23.61 | 23.61 | 23.61 | 23.61 | 23.61 | 23.61 |
| EBITAT | 65.4 | 72.9 | 153.7 | 211.7 | 357.6 | 381.7 | 558.0 | 815.8 | 1,192.8 | 1,743.8 |
| Depreciation | ||||||||||
| Changes in Account Receivables | ||||||||||
| Changes in Inventories | ||||||||||
| Changes in Accounts Payable | ||||||||||
| Capital Expenditure | ||||||||||
| UFCF | -15.7 | -.2 | 104.1 | 224.1 | 327.0 | 240.3 | 331.9 | 485.3 | 709.5 | 1,037.3 |
| WACC, % | 7.38 | 7.33 | 7.32 | 7.33 | 7.42 | 7.36 | 7.36 | 7.36 | 7.36 | 7.36 |
| PV UFCF | ||||||||||
| SUM PV UFCF | 2,165.5 | |||||||||
| Long Term Growth Rate, % | 4.00 | |||||||||
| Free cash flow (T + 1) | 1,079 | |||||||||
| Terminal Value | 32,147 | |||||||||
| Present Terminal Value | 22,543 | |||||||||
| Enterprise Value | 24,708 | |||||||||
| Net Debt | 1,638 | |||||||||
| Equity Value | 23,071 | |||||||||
| Diluted Shares Outstanding, MM | 502 | |||||||||
| Equity Value Per Share | 45.95 |
What You Will Receive
- Modifiable Forecast Inputs: Seamlessly adjust variables (growth %, margins, WACC) to explore various scenarios.
- Real-World Data: InPost S.A.’s financial data pre-filled to streamline your analysis.
- Automated DCF Outputs: The template computes Net Present Value (NPV) and intrinsic value for you.
- Customizable and Professional: A refined Excel model tailored to meet your valuation requirements.
- Designed for Analysts and Investors: Perfect for assessing projections, validating strategies, and enhancing efficiency.
Key Features
- Comprehensive DCF Calculator: Offers detailed unlevered and levered DCF valuation models tailored for InPost S.A. (INPSTAS).
- WACC Tool: Pre-formatted Weighted Average Cost of Capital sheet with adjustable input parameters.
- Customizable Forecast Inputs: Easily modify growth projections, capital expenditures, and discount rates.
- Integrated Financial Ratios: Evaluate profitability, leverage, and efficiency ratios specific to InPost S.A. (INPSTAS).
- Visual Dashboard and Charts: Graphical representations of key valuation metrics for straightforward analysis.
How It Functions
- Obtain the Template: Gain immediate access to the Excel-based InPost S.A. DCF Calculator.
- Enter Your Assumptions: Modify the yellow-highlighted cells for growth rates, WACC, margins, and additional parameters.
- Real-Time Calculations: The model automatically refreshes InPost S.A.'s intrinsic value.
- Experiment with Scenarios: Test various assumptions to assess potential valuation impacts.
- Evaluate and Decide: Leverage the outcomes to inform your investment or financial evaluation.
Why Choose This Calculator for InPost S.A. (INPSTAS)?
- Reliable Data: Utilize authentic InPost financials for dependable valuation insights.
- Fully Customizable: Modify essential parameters such as growth rates, WACC, and tax rates to align with your forecasts.
- Efficient: Built-in calculations save you the hassle of starting from the ground up.
- Professional Quality: Crafted for investors, analysts, and consultants in the financial sector.
- Easy to Use: A clear layout and straightforward instructions ensure a seamless experience for all users.
Who Can Benefit from InPost S.A. (INPSTAS)?
- Investors: Utilize a reliable platform to make informed decisions about parcel delivery and logistics.
- Logistics Professionals: Streamline operations with advanced technology designed for efficiency and effectiveness.
- Retailers: Enhance your customer experience by integrating InPost solutions for seamless shipping and returns.
- E-commerce Business Owners: Gain insights into shipping trends and optimize your fulfillment strategy.
- Students and Scholars: Explore real-world case studies on logistics and technology in your studies.
Contents of the Template
- Preloaded INPSTAS Data: Historical and projected financial information, including revenue, EBIT, and capital expenditures.
- DCF and WACC Models: Professional-grade spreadsheets designed for calculating intrinsic value and Weighted Average Cost of Capital.
- Editable Inputs: Yellow-highlighted fields for modifying revenue growth, tax rates, and discount rates.
- Financial Statements: Detailed annual and quarterly financials for in-depth analysis.
- Key Ratios: Ratios for profitability, leverage, and efficiency to assess performance.
- Dashboard and Charts: Visual representations of valuation results and underlying assumptions.
Disclaimer
All information, articles, and product details provided on this website are for general informational and educational purposes only. We do not claim any ownership over, nor do we intend to infringe upon, any trademarks, copyrights, logos, brand names, or other intellectual property mentioned or depicted on this site. Such intellectual property remains the property of its respective owners, and any references here are made solely for identification or informational purposes, without implying any affiliation, endorsement, or partnership.
We make no representations or warranties, express or implied, regarding the accuracy, completeness, or suitability of any content or products presented. Nothing on this website should be construed as legal, tax, investment, financial, medical, or other professional advice. In addition, no part of this site—including articles or product references—constitutes a solicitation, recommendation, endorsement, advertisement, or offer to buy or sell any securities, franchises, or other financial instruments, particularly in jurisdictions where such activity would be unlawful.
All content is of a general nature and may not address the specific circumstances of any individual or entity. It is not a substitute for professional advice or services. Any actions you take based on the information provided here are strictly at your own risk. You accept full responsibility for any decisions or outcomes arising from your use of this website and agree to release us from any liability in connection with your use of, or reliance upon, the content or products found herein.