
|
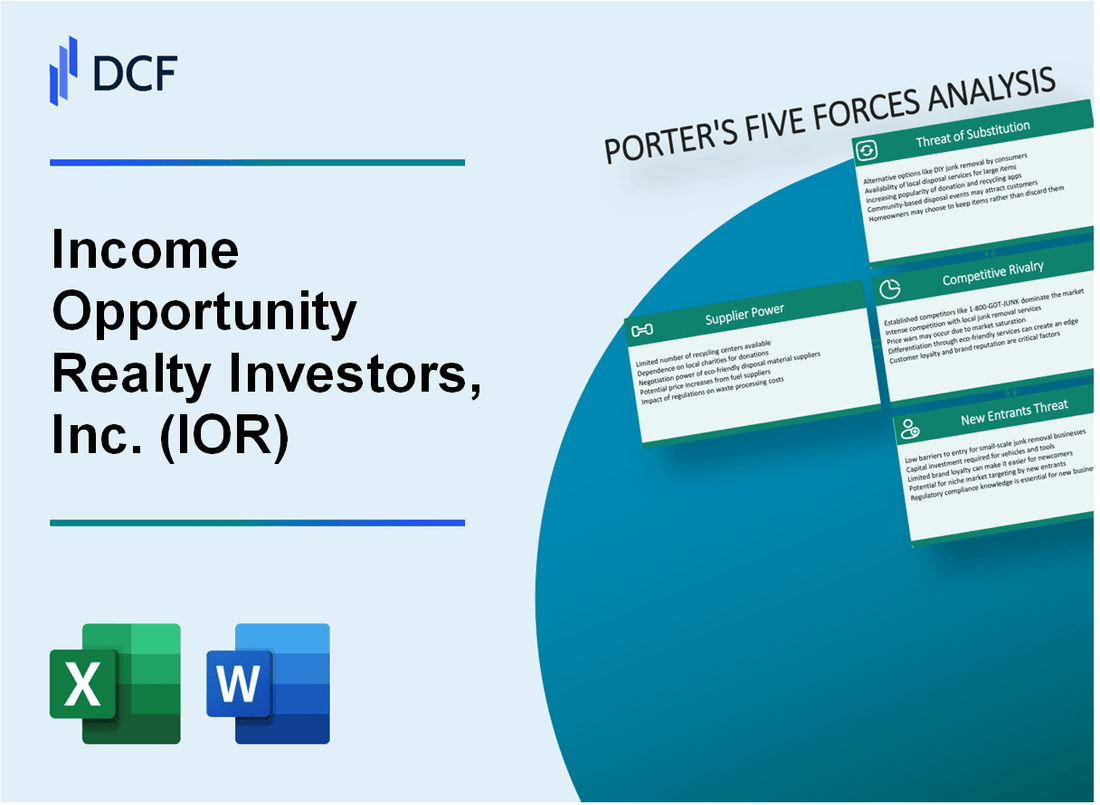
Oportunidad de Ingresos Inversionistas Inmobiliarios, Inc. (IOR): Análisis de 5 Fuerzas [Actualizado en Ene-2025] |
Completamente Editable: Adáptelo A Sus Necesidades En Excel O Sheets
Diseño Profesional: Plantillas Confiables Y Estándares De La Industria
Predeterminadas Para Un Uso Rápido Y Eficiente
Compatible con MAC / PC, completamente desbloqueado
No Se Necesita Experiencia; Fáciles De Seguir
Income Opportunity Realty Investors, Inc. (IOR) Bundle
En el panorama dinámico de los fideicomisos de inversión inmobiliaria (REIT), Income Opportunity Realty Investors, Inc. (IOR) navega por un ecosistema complejo formado por las cinco fuerzas competitivas de Michael Porter. A medida que los inversores buscan oportunidades lucrativas en 2024, comprender la intrincada interacción del poder de los proveedores, la dinámica del cliente, la rivalidad del mercado, las amenazas sustitutivas y los posibles nuevos participantes se vuelven cruciales para la toma de decisiones estratégicas. Este análisis revela los factores críticos que definen el posicionamiento competitivo de IOR, revelando los desafíos y oportunidades matizadas dentro del mercado de inversiones inmobiliarias.
Oportunidad de ingresos Realty Investors, Inc. (IOR) - Las cinco fuerzas de Porter: poder de negociación de los proveedores
Número limitado de proveedores especializados de propiedades de inversión inmobiliaria
A partir de 2024, el mercado de propiedades de inversión inmobiliaria especializada demuestra una concentración significativa:
| Categoría de proveedor | Cuota de mercado | Número de proveedores activos |
|---|---|---|
| Desarrolladores de bienes raíces comerciales | 42.3% | 87 en todo el país |
| Proveedores de propiedades de inversión residencial | 33.6% | 129 en todo el país |
| Proveedores de propiedades REIT especializados | 24.1% | 56 en todo el país |
Altos costos asociados con la adquisición y el desarrollo de propiedades
Costos de adquisición y desarrollo de propiedades en 2024:
- Costo promedio de desarrollo de propiedades comerciales: $ 5.7 millones por proyecto
- Costo promedio de adquisición de propiedades de inversión residencial: $ 1.2 millones
- Gastos de preparación e infraestructura de la tierra: $ 450,000 a $ 750,000 por proyecto
Dependencia de mercados geográficos específicos y tipos de propiedades
| Región geográfica | Volumen de inversión inmobiliaria | Valor de propiedad promedio |
|---|---|---|
| Región del CebTE Sun | $ 3.4 mil millones | $ 2.1 millones |
| Mercados de la costa oeste | $ 2.9 mil millones | $ 3.6 millones |
| Áreas industriales del Medio Oeste | $ 1.8 mil millones | $ 1.5 millones |
Posibles restricciones para obtener propiedades de inversión de alta calidad
Restricciones de abastecimiento de propiedades de inversión en 2024:
- Inventario limitado de propiedades de inversión primaria: 37% de reducción en comparación con 2023
- Restricciones de zonificación que afectan al 62% de los posibles sitios de desarrollo
- Costos de cumplimiento regulatorio: $ 275,000 a $ 475,000 por proyecto
Ingresos Oportunidad Realty Investors, Inc. (IOR) - Las cinco fuerzas de Porter: poder de negociación de los clientes
Análisis de base de inversores diversos
A partir del cuarto trimestre de 2023, Income Opportunity Realty Investors, Inc. (IOR) informó la siguiente composición del inversionista:
| Categoría de inversionista | Porcentaje |
|---|---|
| Inversores institucionales | 62.4% |
| Inversores minoristas | 37.6% |
Cambiar los costos y la dinámica de la inversión
El cambio de costos de los inversores entre fideicomisos de inversión inmobiliaria (REIT) incluye:
- Tarifas de transacción con un promedio de $ 19.50 por operación
- Implicaciones fiscales potenciales
- Costo de oportunidad de la reasignación de cartera
Sensibilidad al rendimiento de dividendos
El rendimiento de dividendos de IOR en 2023:
| Métrico | Valor |
|---|---|
| Rendimiento de dividendos | 4.7% |
| Dividendo anual por acción | $1.84 |
Influencias de la condición del mercado
Indicadores del mercado inmobiliario que afectan la demanda de los inversores:
- Tasa de vacantes de bienes raíces comerciales de EE. UU.: 12.8%
- Tasa de capitalización promedio: 6.5%
- Capitalización total de mercado de REIT: $ 1.3 billones
Métricas de demanda de inversores
| Indicador de demanda | Valor 2023 |
|---|---|
| Total de accionistas | 14,237 |
| Tamaño de inversión promedio | $47,300 |
| Entrada de inversión neta | $ 42.6 millones |
Ingreso Oportunidad Realty Investors, Inc. (IOR) - Las cinco fuerzas de Porter: rivalidad competitiva
Panorama competitivo Overview
A partir de 2024, Income Opportunity Realty Investors, Inc. opera en un mercado REIT altamente competitivo con la siguiente dinámica competitiva:
| Métrico | Valor |
|---|---|
| Número total de REIT competidores | 224 |
| Gama de capitalización de mercado de competidores | $ 50 millones - $ 75 mil millones |
| Rendimiento de dividendos promedio en el sector | 4.3% |
| Volumen de transacción de propiedad anual | $ 127.6 mil millones |
Indicadores de presión competitivos
- Relación de concentración del sector: Control de los 10 REIT principales 42.7% de la cuota de mercado
- Tasa de facturación de la cartera de propiedades anuales promedio: 17.3%
- Distribución de dividendos competitivos medios: 4.1%
Factores competitivos estratégicos
Los diferenciadores competitivos clave incluyen:
- Diversificación geográfica de propiedad de inversión
- Rendimiento de la tasa de ocupación
- Costo de la eficiencia de capital
- Consistencia de dividendos
| Métrica de rendimiento competitivo | IOR POSICIÓN |
|---|---|
| Puntaje de diversificación de cartera | 7.2/10 |
| Relación de eficiencia operativa | 0.63 |
| Percentil de retorno total | 62º percentil |
Ingresos Oportunidad Realty Investors, Inc. (IOR) - Las cinco fuerzas de Porter: amenaza de sustitutos
Opciones de inversión alternativas
A partir de 2024, las opciones de inversión alternativas presentan una competencia significativa a los fideicomisos de inversión inmobiliaria (REIT) como Income Opportunity Realty Investors, Inc.
| Vehículo de inversión | Rendimiento anual promedio | Liquidez |
|---|---|---|
| Fondos de índice S&P 500 | 10.26% | Alto |
| Bonos corporativos | 4.75% | Medio |
| ETF de bienes raíces | 8.12% | Alto |
Plataformas de crowdfunding inmobiliario
Las plataformas de crowdfunding han ganado una tracción sustancial del mercado:
- La plataforma de fondos recaudó $ 2.5 mil millones en 2023
- CrowdStreet generó $ 1.8 mil millones en inversiones inmobiliarias
- Mínimo de inversión promedio: $ 500- $ 10,000
Tecnologías de inversión digital
| Plataforma digital | Activos totales bajo administración | Tasa de crecimiento de los usuarios |
|---|---|---|
| Robinidad | $ 95.3 mil millones | 22.4% |
| Riqueza | $ 41.2 mil millones | 18.7% |
Vehículos de inversión competitivos
Análisis comparativo de retornos ajustados al riesgo:
- Retorno promedio de IOR: 6.85%
- Retorno promedio del sector REIT: 7.23%
- Fondos mutuos inmobiliarios Retorno promedio: 7.56%
Ingreso Oportunidad Realty Investors, Inc. (IOR) - Las cinco fuerzas de Porter: amenaza de nuevos participantes
Requisitos de capital significativos para ingresar al mercado de REIT
A partir de 2024, el requisito de capital inicial para establecer un REIT oscila entre $ 10 millones y $ 50 millones. Income Opportunity Realty Investors, Inc. tiene una capitalización de mercado de $ 287.6 millones, creando una barrera sustancial para posibles nuevos participantes.
| Categoría de requisitos de capital | Rango de costos estimado |
|---|---|
| Adquisición de propiedad inicial | $ 15-30 millones |
| Configuración de cumplimiento regulatorio | $ 2-5 millones |
| Infraestructura tecnológica | $ 1-3 millones |
Cumplimiento regulatorio complejo y procesos de licencia
La Comisión de Bolsa y Valores (SEC) exige requisitos de cumplimiento estrictos para REIT, que incluyen:
- El 90% mínimo del ingreso imponible distribuido a los accionistas
- Al menos el 75% del total de activos invertidos en bienes raíces
- Mantener el estado comercial público
Reproductores del mercado establecidos con un fuerte reconocimiento de marca
Los 5 principales actores del mercado de REIT controlan aproximadamente el 42% de la cuota de mercado total, con Income Opportunity Realty Investors, Inc. que ocupa una posición de mercado del 6,7%.
| Empresa REIT | Cuota de mercado |
|---|---|
| REIT más grande | 12.3% |
| Segundo REIT más grande | 10.5% |
| Oportunidad de ingresos Realty Investors, Inc. | 6.7% |
Experiencia técnica necesaria en la gestión de inversiones inmobiliarias
Las habilidades especializadas requeridas para la gestión de REIT incluyen:
- Experiencia avanzada de modelado financiero
- Capacidades de análisis de mercado inmobiliario
- Mínimo 7-10 años de experiencia en inversión profesional
- Credenciales de analistas financieros certificados
El salario anual promedio para un gerente senior de inversiones de REIT varía de $ 185,000 a $ 250,000, que representa una importante inversión de capital humano para los nuevos participantes del mercado.
Income Opportunity Realty Investors, Inc. (IOR) - Porter's Five Forces: Competitive rivalry
You're looking at Income Opportunity Realty Investors, Inc. (IOR) and trying to size up the competition it faces-that's smart analysis. The rivalry force in the US real estate investment trust (REIT) space is defintely intense.
The broader US real estate investment and REIT industry features massive, diversified players. Income Opportunity Realty Investors, Inc. (IOR) operates with a small market cap, which limits its ability to compete on scale against those giants. As of late November 2025, Income Opportunity Realty Investors, Inc. (IOR) carried a market capitalization of approximately $72.85 million. That small base means it can't match the purchasing power or operational efficiencies of the major, diversified REIT competitors.
Still, Income Opportunity Realty Investors, Inc. (IOR) has carved out a niche that offers some insulation from the direct property-to-property competition. Its focus is heavily weighted toward notes receivable and transactions with related parties. This specialization means its primary competitive battles aren't always over acquiring the same physical office building or apartment complex as a large-cap peer.
Here's a quick look at how the related-party structure shows up in the numbers from the third quarter of 2025:
| Metric (USD thousands) | Three Months Ended Sept 30, 2025 | Three Months Ended Sept 30, 2024 |
|---|---|---|
| Net Income Attributable to Common Shares | 1,000 | 1,200 |
| Interest Income from Related Parties | 1,395 | 1,614 |
| Advisory Fee to Related Party | 27 | 26 |
The interest income from related parties, which was $1,395 thousand for the three months ended September 30, 2025, is central to its operations, showing where a significant portion of its revenue stream originates. The advisory fee to a related party was $27 thousand in the same period. This structure suggests that a key part of the rivalry dynamic is internal or within its specific investment ecosystem, rather than purely external market competition for assets.
Now, let's talk stock market signals. The stock beta for Income Opportunity Realty Investors, Inc. (IOR) sits at a very low 0.04. This figure indicates very low historical volatility relative to the broader market. But don't confuse low stock volatility with low business rivalry. A low beta just means the stock price hasn't moved much compared to the S\&P 500; it doesn't mean the underlying business isn't fighting hard for its niche returns.
The competitive landscape for Income Opportunity Realty Investors, Inc. (IOR) can be summarized by these factors:
- Rivalry is high in the general REIT sector.
- Scale disadvantages are present due to a market cap near $73 million.
- Niche focus on notes receivable mitigates direct property rivalry.
- Low stock beta of 0.04 reflects market perception of risk, not rivalry intensity.
- Insider ownership is extremely high, at 90.32% as of May 2025, which changes the dynamic with external shareholders.
Finance: draft a sensitivity analysis on interest income from related parties dropping by 10% by next Tuesday.
Income Opportunity Realty Investors, Inc. (IOR) - Porter's Five Forces: Threat of substitutes
You're looking at Income Opportunity Realty Investors, Inc. (IOR) and wondering how easily an investor can find a similar income stream elsewhere. Honestly, the threat of substitutes is quite pronounced here, given the company's structure.
The threat is high from diversified REITs and direct real estate investment funds. Income Opportunity Realty Investors, Inc. primarily holds a portfolio of notes receivable, but investors seeking real estate exposure can easily pivot to broader, more liquid, or more diversified REITs. These alternatives often offer immediate liquidity and established dividend policies, which Income Opportunity Realty Investors, Inc. does not provide for its common shareholders. The market capitalization for Income Opportunity Realty Investors, Inc. as of late 2025 is relatively small at $72.85 million, making it an easier target for substitution by larger, more established real estate vehicles.
Mortgage-backed securities and other debt instruments directly substitute for Income Opportunity Realty Investors, Inc.'s notes receivable portfolio. When investors are primarily seeking fixed-income-like returns derived from real estate assets, these securities offer a direct, often more standardized, alternative. The core of Income Opportunity Realty Investors, Inc.'s business is generating interest income from these receivables, which was $1,395 thousand for the three months ended September 30, 2025. Any product offering comparable yield and risk profile in the debt space acts as a strong substitute.
Alternative income-focused investments are strong substitutes as Income Opportunity Realty Investors, Inc. has historically not paid common stock dividends. This is a critical point. If an investor's primary goal is current cash flow from their investment, the absence of a common stock dividend forces them to look elsewhere. For example, the search for yield might lead an investor to high-yield corporate bonds, preferred stocks, or even certain infrastructure funds. The Q3 2025 performance shows net income attributable to common shares of $1.0 million, but that did not translate into common dividends for that period, making substitutes very attractive.
The Q3 2025 diluted EPS of $0.25 is easily substituted by higher-yielding financial products. When you look at the earnings power versus the market price, the Price/Earnings Ratio was 17.21 based on the latest reported figures. If other income-focused investments are offering better risk-adjusted returns or a higher yield on cost, that $0.25 per share earned in the quarter becomes less compelling. Here's a quick look at the recent operating snapshot:
| Metric | Q3 2025 Value | Q3 2024 Value |
|---|---|---|
| Net Income (in thousands) | $1,031 | $1,198 |
| Diluted EPS | $0.25 | $0.29 |
| Interest Income from Related Parties (in thousands) | $1,395 | $1,614 |
| Weighted Avg. Common Shares (in thousands) | 4,066 | 4,070 |
The low beta of 0.04 suggests low stock price volatility, which might appeal to some, but for income seekers, the lack of a direct payout is a major hurdle. You have to consider what else is available in the fixed-income and real estate adjacent markets that offer a more direct return mechanism. These substitutes compete directly for the capital that might otherwise flow into Income Opportunity Realty Investors, Inc. for its notes receivable exposure.
The competitive pressure from substitutes manifests in several ways:
- Diversified REITs offer immediate, regular common dividends.
- MBS provide direct, liquid exposure to real estate debt cash flows.
- Alternative income funds often have higher current yields.
- The $0.25 diluted EPS in Q3 2025 did not generate common shareholder distributions.
- The company's small size (Market Cap $72.85 million) makes it less of a core holding.
Finance: draft a comparison of IOR's P/E of 17.21 against the average P/E for the Mortgage Finance industry sector as of Q4 2025 by next Tuesday.
Income Opportunity Realty Investors, Inc. (IOR) - Porter's Five Forces: Threat of new entrants
You're looking at the barriers to entry for a new player trying to set up shop exactly like Income Opportunity Realty Investors, Inc. (IOR). The threat here isn't zero, but it's definitely dampened by a few structural realities.
Low threat for new entrants to replicate the specific, externally managed, related-party debt structure.
Replicating IOR's structure means setting up the same web of related-party agreements. This isn't just about buying notes receivable; it's about the governance around them. You'd need to establish a similar advisory relationship, which for the quarter ended September 30, 2025, involved an advisory fee to a related party of $27,000. Furthermore, the core of their income stream is tied to these relationships, with interest income from related parties hitting $1,395,000 for that same quarter. Building that level of embedded, long-term, and complex related-party financing takes time and specific historical agreements that a new entrant simply won't have on day one. It's a structural moat, not a product moat.
High capital requirements and regulatory hurdles for a new NYSE American-listed real estate company.
Listing on the NYSE American itself is a hurdle. It demands compliance with SEC regulations and exchange rules that require significant upfront capital and ongoing administrative overhead. A new entrant needs to raise enough capital to be meaningful, yet IOR's current market capitalization sits at just $72.85 million as of late November 2025. This small size suggests that the initial capital raise required to be taken seriously on a major exchange is substantial relative to the current market valuation. The regulatory path for a newly formed real estate investment trust or similar entity is definitely not a quick process.
- Listing on NYSE American requires meeting specific financial thresholds.
- Regulatory compliance costs are substantial for new public filings.
- The path to achieving a market cap near $72.85 million is long.
General real estate investment is easy, but IOR's specialized notes receivable portfolio is harder to build quickly.
Anyone can buy a property, sure. But Income Opportunity Realty Investors, Inc. focuses on a portfolio of notes receivable, supplemented by direct equity ownership and partnerships. Sourcing and underwriting a quality portfolio of mortgage notes that generate consistent interest income, like the $1,395,000 reported for Q3 2025, requires specialized expertise that isn't easily hired away. This specialization acts as a barrier. You can't just buy a competitor's portfolio overnight; you have to originate or acquire that specific asset class through established channels.
The small scale of IOR makes it an unattractive target for large new entrants to focus on.
To be frank, the size of Income Opportunity Realty Investors, Inc. is a deterrent for major institutional players looking for scale. With a market capitalization of $72.85 million, the company is small enough that a large private equity fund or a major REIT would likely see the transaction costs and integration effort as disproportionate to the potential return. A large entrant needs billions in assets, not millions. The latest reported revenue for the quarter ended September 30, 2025, was $1.40 million. That scale simply doesn't move the needle for the big guys.
Here's a quick look at the scale and recent performance context:
| Metric (Dollars in thousands) | Q3 Ended Sep 30, 2025 | Q3 Ended Sep 30, 2024 |
|---|---|---|
| Net Income | $1,031 | $1,198 |
| Interest Income from Related Parties | $1,395 | $1,614 |
| Total Operating Expenses | $90 | $97 |
| Earnings Per Share (Diluted) | $0.25 | $0.29 |
The fact that the controlling shareholder, Transcontinental Realty Investors, Inc. (TCI), owned approximately 84.5% of the stock as of September 30, 2025, also suggests that a hostile takeover or easy acquisition is highly unlikely, as the controlling block is firmly in place.
Disclaimer
All information, articles, and product details provided on this website are for general informational and educational purposes only. We do not claim any ownership over, nor do we intend to infringe upon, any trademarks, copyrights, logos, brand names, or other intellectual property mentioned or depicted on this site. Such intellectual property remains the property of its respective owners, and any references here are made solely for identification or informational purposes, without implying any affiliation, endorsement, or partnership.
We make no representations or warranties, express or implied, regarding the accuracy, completeness, or suitability of any content or products presented. Nothing on this website should be construed as legal, tax, investment, financial, medical, or other professional advice. In addition, no part of this site—including articles or product references—constitutes a solicitation, recommendation, endorsement, advertisement, or offer to buy or sell any securities, franchises, or other financial instruments, particularly in jurisdictions where such activity would be unlawful.
All content is of a general nature and may not address the specific circumstances of any individual or entity. It is not a substitute for professional advice or services. Any actions you take based on the information provided here are strictly at your own risk. You accept full responsibility for any decisions or outcomes arising from your use of this website and agree to release us from any liability in connection with your use of, or reliance upon, the content or products found herein.