
|
Valoración de DCF de IPCA Laboratories Limited (IPCALAB.NS) |
Completamente Editable: Adáptelo A Sus Necesidades En Excel O Sheets
Diseño Profesional: Plantillas Confiables Y Estándares De La Industria
Predeterminadas Para Un Uso Rápido Y Eficiente
Compatible con MAC / PC, completamente desbloqueado
No Se Necesita Experiencia; Fáciles De Seguir
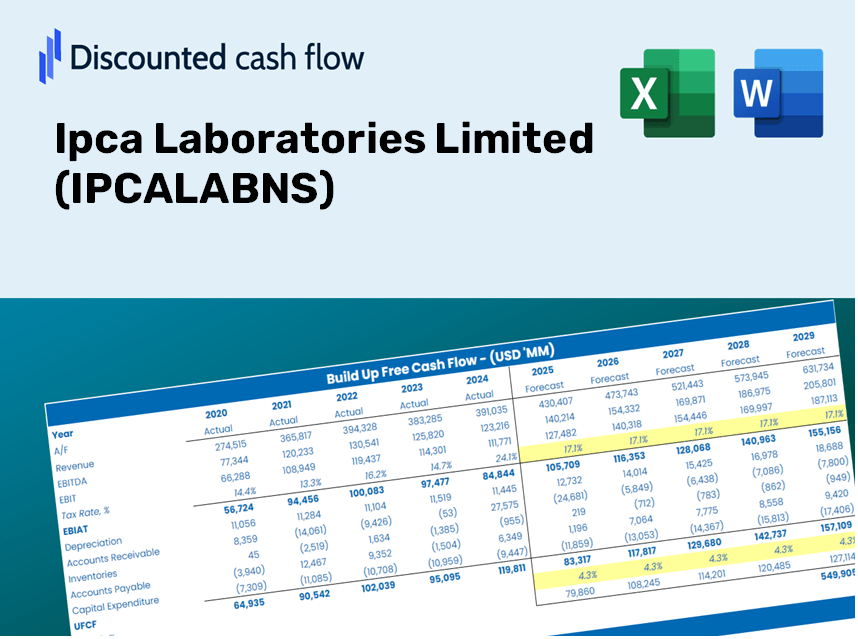
Ipca Laboratories Limited (IPCALAB.NS) Bundle
¡Simplifique la valoración limitada de IPCA Laboratories con esta calculadora DCF personalizable! Con el Real IPCA Laboratories Limited Financials y las entradas de pronóstico ajustables, puede probar escenarios y descubrir el valor razonable de IPCA Laboratories Limited en minutos.
Discounted Cash Flow (DCF) - (USD MM)
| Year | AY1 2021 |
AY2 2022 |
AY3 2023 |
AY4 2024 |
AY5 2025 |
FY1 2026 |
FY2 2027 |
FY3 2028 |
FY4 2029 |
FY5 2030 |
|---|---|---|---|---|---|---|---|---|---|---|
| Revenue | 54,207.3 | 58,305.0 | 62,481.1 | 77,058.8 | 89,412.2 | 101,501.7 | 115,225.8 | 130,805.6 | 148,491.9 | 168,569.7 |
| Revenue Growth, % | 0 | 7.56 | 7.16 | 23.33 | 16.03 | 13.52 | 13.52 | 13.52 | 13.52 | 13.52 |
| EBITDA | 15,073.1 | 12,748.9 | 9,460.4 | 12,643.9 | 16,667.5 | 20,272.5 | 23,013.5 | 26,125.2 | 29,657.6 | 33,667.7 |
| EBITDA, % | 27.81 | 21.87 | 15.14 | 16.41 | 18.64 | 19.97 | 19.97 | 19.97 | 19.97 | 19.97 |
| Depreciation | 1,927.2 | 2,158.3 | 2,426.9 | 3,327.9 | 3,694.7 | 3,977.3 | 4,515.0 | 5,125.5 | 5,818.5 | 6,605.3 |
| Depreciation, % | 3.56 | 3.7 | 3.88 | 4.32 | 4.13 | 3.92 | 3.92 | 3.92 | 3.92 | 3.92 |
| EBIT | 13,145.9 | 10,590.6 | 7,033.5 | 9,316.0 | 12,972.8 | 16,295.2 | 18,498.5 | 20,999.7 | 23,839.1 | 27,062.4 |
| EBIT, % | 24.25 | 18.16 | 11.26 | 12.09 | 14.51 | 16.05 | 16.05 | 16.05 | 16.05 | 16.05 |
| Total Cash | 7,576.4 | 13,586.8 | 21,790.7 | 8,453.5 | 11,076.2 | 19,389.5 | 22,011.2 | 24,987.4 | 28,365.9 | 32,201.3 |
| Total Cash, percent | .0 | .0 | .0 | .0 | .0 | .0 | .0 | .0 | .0 | .0 |
| Account Receivables | 8,156.9 | 9,180.0 | 9,961.1 | 16,946.1 | 19,165.8 | 18,303.1 | 20,777.9 | 23,587.2 | 26,776.5 | 30,397.0 |
| Account Receivables, % | 15.05 | 15.74 | 15.94 | 21.99 | 21.44 | 18.03 | 18.03 | 18.03 | 18.03 | 18.03 |
| Inventories | 15,948.1 | 18,579.7 | 17,433.7 | 24,695.6 | 25,604.2 | 30,424.8 | 34,538.5 | 39,208.5 | 44,509.9 | 50,528.1 |
| Inventories, % | 29.42 | 31.87 | 27.9 | 32.05 | 28.64 | 29.97 | 29.97 | 29.97 | 29.97 | 29.97 |
| Accounts Payable | 6,648.6 | 5,577.0 | 5,250.6 | 7,760.8 | 8,461.7 | 10,103.2 | 11,469.3 | 13,020.1 | 14,780.5 | 16,779.0 |
| Accounts Payable, % | 12.27 | 9.57 | 8.4 | 10.07 | 9.46 | 9.95 | 9.95 | 9.95 | 9.95 | 9.95 |
| Capital Expenditure | -3,615.5 | -4,789.5 | -4,944.7 | -4,112.9 | -7,755.7 | -7,472.5 | -8,482.9 | -9,629.8 | -10,931.9 | -12,410.0 |
| Capital Expenditure, % | -6.67 | -8.21 | -7.91 | -5.34 | -8.67 | -7.36 | -7.36 | -7.36 | -7.36 | -7.36 |
| Tax Rate, % | 34.65 | 34.65 | 34.65 | 34.65 | 34.65 | 34.65 | 34.65 | 34.65 | 34.65 | 34.65 |
| EBITAT | 10,849.7 | 8,400.6 | 4,526.6 | 6,096.6 | 8,477.5 | 11,634.9 | 13,208.0 | 14,993.9 | 17,021.2 | 19,322.7 |
| Depreciation | ||||||||||
| Changes in Account Receivables | ||||||||||
| Changes in Inventories | ||||||||||
| Changes in Accounts Payable | ||||||||||
| Capital Expenditure | ||||||||||
| UFCF | -8,295.0 | 1,043.1 | 2,047.3 | -6,425.1 | 1,989.1 | 5,823.3 | 4,017.7 | 4,561.0 | 5,177.6 | 5,877.7 |
| WACC, % | 4.57 | 4.56 | 4.52 | 4.52 | 4.52 | 4.54 | 4.54 | 4.54 | 4.54 | 4.54 |
| PV UFCF | ||||||||||
| SUM PV UFCF | 22,283.7 | |||||||||
| Long Term Growth Rate, % | 4.00 | |||||||||
| Free cash flow (T + 1) | 6,113 | |||||||||
| Terminal Value | 1,138,881 | |||||||||
| Present Terminal Value | 912,291 | |||||||||
| Enterprise Value | 934,575 | |||||||||
| Net Debt | 10,185 | |||||||||
| Equity Value | 924,390 | |||||||||
| Diluted Shares Outstanding, MM | 254 | |||||||||
| Equity Value Per Share | 3,643.58 |
What You Will Receive
- Authentic Ipca Data: Preloaded financials – ranging from revenue to EBIT – based on real and projected figures.
- Comprehensive Customization: Modify all essential parameters (yellow cells) such as WACC, growth %, and tax rates.
- Immediate Valuation Updates: Automatic recalculations to assess the impact of changes on Ipca Laboratories’ fair value.
- Flexible Excel Template: Designed for quick adjustments, scenario analysis, and thorough projections.
- Efficient and Precise: Avoid building models from the ground up while ensuring accuracy and adaptability.
Key Features
- 🔍 Real-Life IPCALABNS Financials: Pre-loaded historical and projected data for Ipca Laboratories Limited.
- ✏️ Fully Customizable Inputs: Modify all essential parameters (yellow cells) such as WACC, growth %, and tax rates.
- 📊 Professional DCF Valuation: Integrated formulas assess Ipca's intrinsic value using the Discounted Cash Flow approach.
- ⚡ Instant Results: Get an immediate visualization of Ipca’s valuation after adjustments.
- Scenario Analysis: Evaluate and contrast outcomes for different financial assumptions side-by-side.
How It Works
- Step 1: Download the prebuilt Excel template containing data for Ipca Laboratories Limited (IPCALABNS).
- Step 2: Review the pre-filled sheets to familiarize yourself with the essential metrics.
- Step 3: Modify forecasts and assumptions in the editable yellow cells (WACC, growth, margins).
- Step 4: Instantly view recalculated results, including the intrinsic value of Ipca Laboratories Limited (IPCALABNS).
- Step 5: Make well-informed investment decisions or generate reports using the provided outputs.
Why Choose This Calculator for Ipca Laboratories Limited (IPCALABNS)?
- User-Friendly Interface: Tailored for both novices and seasoned professionals.
- Customizable Inputs: Easily adjust variables to fit your specific analysis needs.
- Real-Time Updates: Monitor immediate changes in Ipca's valuation as you modify inputs.
- Preconfigured Data: Comes with Ipca's actual financial information for swift analysis.
- Relied Upon by Experts: Widely used by investors and analysts for making strategic decisions.
Who Can Benefit from This Product?
- Pharmaceutical Students: Master valuation techniques with practical applications using real-world data.
- Researchers: Integrate industry-standard models into your studies or publications.
- Investors: Evaluate your predictions and assess the valuation results for Ipca Laboratories Limited (IPCALABNS).
- Market Analysts: Enhance your efficiency with a ready-to-use, customizable DCF model.
- Healthcare Entrepreneurs: Discover insights into the analytical methods used for evaluating large pharmaceutical companies like Ipca Laboratories Limited (IPCALABNS).
Contents of the Template
- Preloaded IPCALABNS Data: Historical and forecasted financial metrics, including revenue, EBIT, and capital expenditures.
- DCF and WACC Models: High-quality spreadsheets designed for calculating intrinsic value and Weighted Average Cost of Capital.
- Editable Inputs: Cells highlighted in yellow for modifying revenue growth, tax rates, and discount rates.
- Financial Statements: Detailed annual and quarterly financial reports for in-depth analysis.
- Key Ratios: Measures of profitability, leverage, and efficiency for performance evaluation.
- Dashboard and Charts: Visual representations of valuation results and underlying assumptions.
Disclaimer
All information, articles, and product details provided on this website are for general informational and educational purposes only. We do not claim any ownership over, nor do we intend to infringe upon, any trademarks, copyrights, logos, brand names, or other intellectual property mentioned or depicted on this site. Such intellectual property remains the property of its respective owners, and any references here are made solely for identification or informational purposes, without implying any affiliation, endorsement, or partnership.
We make no representations or warranties, express or implied, regarding the accuracy, completeness, or suitability of any content or products presented. Nothing on this website should be construed as legal, tax, investment, financial, medical, or other professional advice. In addition, no part of this site—including articles or product references—constitutes a solicitation, recommendation, endorsement, advertisement, or offer to buy or sell any securities, franchises, or other financial instruments, particularly in jurisdictions where such activity would be unlawful.
All content is of a general nature and may not address the specific circumstances of any individual or entity. It is not a substitute for professional advice or services. Any actions you take based on the information provided here are strictly at your own risk. You accept full responsibility for any decisions or outcomes arising from your use of this website and agree to release us from any liability in connection with your use of, or reliance upon, the content or products found herein.