
|
Valoración de DCF de la Agencia de Desarrollo de Energía Renovable India (IREDA.NS) |
Completamente Editable: Adáptelo A Sus Necesidades En Excel O Sheets
Diseño Profesional: Plantillas Confiables Y Estándares De La Industria
Predeterminadas Para Un Uso Rápido Y Eficiente
Compatible con MAC / PC, completamente desbloqueado
No Se Necesita Experiencia; Fáciles De Seguir
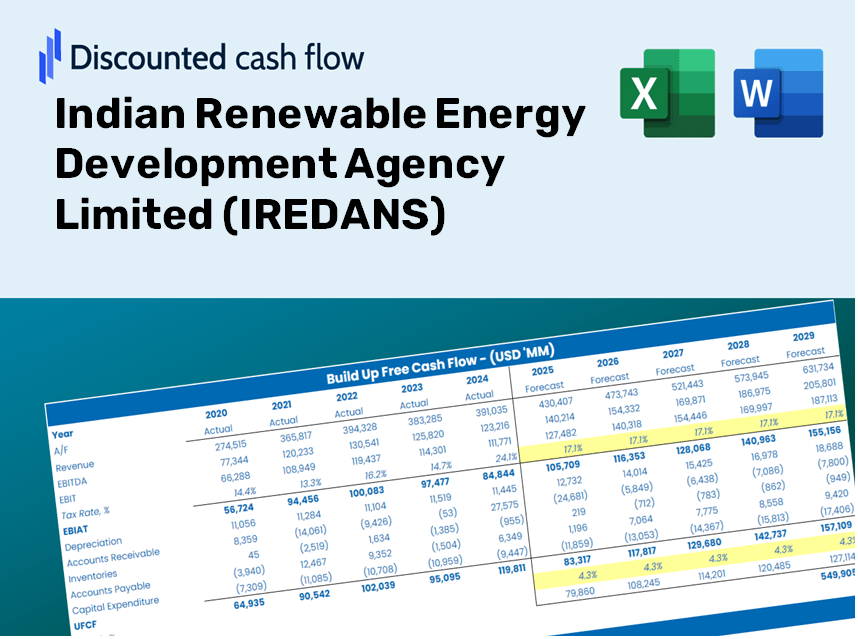
Indian Renewable Energy Development Agency Limited (IREDA.NS) Bundle
¡Descubra el verdadero valor de la Agencia de Desarrollo de Energía Renovable India Limited (iredans) con nuestra calculadora DCF avanzada! Ajuste los supuestos clave, explore varios escenarios y evalúe cómo los cambios afectan la valoración de la Agencia de Desarrollo de Energía Renovable de la India Limited (iredans), todo dentro de una plantilla integral de Excel.
Discounted Cash Flow (DCF) - (USD MM)
| Year | AY1 2021 |
AY2 2022 |
AY3 2023 |
AY4 2024 |
AY5 2025 |
FY1 2026 |
FY2 2027 |
FY3 2028 |
FY4 2029 |
FY5 2030 |
|---|---|---|---|---|---|---|---|---|---|---|
| Revenue | 25,565.8 | 27,796.8 | 34,151.1 | 18,684.1 | 66,595.6 | 80,963.0 | 98,430.0 | 119,665.3 | 145,482.0 | 176,868.4 |
| Revenue Growth, % | 0 | 8.73 | 22.86 | -45.29 | 256.43 | 21.57 | 21.57 | 21.57 | 21.57 | 21.57 |
| EBITDA | 14,920.7 | 17,380.3 | 20,606.2 | 28,513.2 | 63,076.7 | 60,874.9 | 74,008.1 | 89,974.6 | 109,385.8 | 132,984.8 |
| EBITDA, % | 58.36 | 62.53 | 60.34 | 152.61 | 94.72 | 75.19 | 75.19 | 75.19 | 75.19 | 75.19 |
| Depreciation | 226.7 | 232.4 | 235.0 | 303.5 | 388.7 | 747.9 | 909.3 | 1,105.5 | 1,344.0 | 1,633.9 |
| Depreciation, % | 0.88689 | 0.83618 | 0.68807 | 1.62 | 0.58367 | 0.92381 | 0.92381 | 0.92381 | 0.92381 | 0.92381 |
| EBIT | 14,694.0 | 17,147.9 | 20,371.2 | 28,209.7 | 62,688.0 | 60,390.0 | 73,418.5 | 89,257.9 | 108,514.4 | 131,925.4 |
| EBIT, % | 57.48 | 61.69 | 59.65 | 150.98 | 94.13 | 74.59 | 74.59 | 74.59 | 74.59 | 74.59 |
| Total Cash | 6,033.1 | 5,266.9 | 9,119.8 | 6,882.9 | 11,240.5 | 19,911.7 | 24,207.5 | 29,430.0 | 35,779.2 | 43,498.3 |
| Total Cash, percent | .0 | .0 | .0 | .0 | .0 | .0 | .0 | .0 | .0 | .0 |
| Account Receivables | 49,716.1 | 62,843.2 | 16,865.0 | 16,911.3 | 127,165.5 | 71,230.5 | 86,597.8 | 105,280.5 | 127,993.8 | 155,607.2 |
| Account Receivables, % | 194.46 | 226.08 | 49.38 | 90.51 | 190.95 | 87.98 | 87.98 | 87.98 | 87.98 | 87.98 |
| Inventories | .0 | -366,861.5 | 86,315.8 | .0 | .0 | .0 | .0 | .0 | .0 | .0 |
| Inventories, % | 0 | -1319.8 | 252.75 | 0 | 0 | 0 | 0 | 0 | 0 | 0 |
| Accounts Payable | 221.0 | 47.7 | 44.9 | 73.0 | 91.2 | 274.5 | 333.7 | 405.7 | 493.2 | 599.6 |
| Accounts Payable, % | 0.86424 | 0.17142 | 0.13149 | 0.39088 | 0.13695 | 0.339 | 0.339 | 0.339 | 0.339 | 0.339 |
| Capital Expenditure | -21.0 | -81.3 | -173.1 | -187.9 | -256.5 | -368.0 | -447.3 | -543.8 | -661.2 | -803.8 |
| Capital Expenditure, % | -0.08219183 | -0.29245 | -0.50679 | -1.01 | -0.38516 | -0.45447 | -0.45447 | -0.45447 | -0.45447 | -0.45447 |
| Tax Rate, % | 19.26 | 19.26 | 19.26 | 19.26 | 19.26 | 19.26 | 19.26 | 19.26 | 19.26 | 19.26 |
| EBITAT | 8,936.9 | 13,028.5 | 15,460.6 | 20,961.4 | 50,612.6 | 44,415.0 | 53,997.1 | 65,646.5 | 79,809.1 | 97,027.2 |
| Depreciation | ||||||||||
| Changes in Account Receivables | ||||||||||
| Changes in Inventories | ||||||||||
| Changes in Accounts Payable | ||||||||||
| Capital Expenditure | ||||||||||
| UFCF | -40,352.5 | 366,740.8 | -391,679.3 | 107,374.6 | -59,491.3 | 100,913.2 | 39,151.0 | 47,597.4 | 57,866.1 | 70,350.2 |
| WACC, % | 7.42 | 7.77 | 7.76 | 7.73 | 7.87 | 7.71 | 7.71 | 7.71 | 7.71 | 7.71 |
| PV UFCF | ||||||||||
| SUM PV UFCF | 257,039.3 | |||||||||
| Long Term Growth Rate, % | 2.00 | |||||||||
| Free cash flow (T + 1) | 71,757 | |||||||||
| Terminal Value | 1,256,420 | |||||||||
| Present Terminal Value | 866,621 | |||||||||
| Enterprise Value | 1,123,661 | |||||||||
| Net Debt | 646,830 | |||||||||
| Equity Value | 476,831 | |||||||||
| Diluted Shares Outstanding, MM | 2,687 | |||||||||
| Equity Value Per Share | 177.44 |
Benefits of Using IREDANS ([IREDANS])
- Adjustable Forecast Variables: Effortlessly modify key inputs (growth %, profit margins, WACC) to explore various scenarios.
- Real-Time Market Insights: Access pre-filled financial data from IREDANS ([IREDANS]) to kickstart your analysis.
- Instant DCF Calculations: The template automatically computes the Net Present Value (NPV) and intrinsic value for you.
- Tailorable and Professional: A refined Excel model designed to meet your valuation requirements.
- Designed for Analysts and Investors: Perfect for evaluating forecasts, confirming strategies, and optimizing your time.
Key Features
- Comprehensive Renewable Energy Data: Access precise pre-loaded historical figures and forward-looking estimates for IREDANS (IREDANS).
- Customizable Assumptions: Modify highlighted fields like WACC, growth rates, and profit margins to suit your analysis.
- Real-Time Calculations: Instant updates for DCF, Net Present Value (NPV), and cash flow evaluations.
- Interactive Dashboard: User-friendly charts and summaries to help you visualize and interpret your valuation outcomes.
- Designed for All Experience Levels: A straightforward, user-friendly layout catering to investors, CFOs, and consultants alike.
How It Functions
- Download the Template: Obtain immediate access to the Excel-based IREDANS DCF Calculator.
- Input Your Assumptions: Modify the yellow-highlighted cells for growth rates, WACC, margins, and additional parameters.
- Instant Calculations: The model will automatically recalculate the intrinsic value of Indian Renewable Energy Development Agency Limited (IREDANS).
- Test Scenarios: Experiment with various assumptions to assess potential changes in valuation.
- Analyze and Decide: Utilize the findings to inform your investment or financial evaluations.
Why Opt for the IREDANS Calculator?
- Precision: Utilizes authentic IREDANS financial data to ensure high accuracy.
- Versatility: Built to allow users to experiment and adjust inputs effortlessly.
- Efficiency: Avoid the complexities of creating a financial model from the ground up.
- Expert-Level: Crafted with the expertise and attention to detail expected at a CFO level.
- Intuitive: Simple to navigate, catering to users without extensive financial modeling skills.
Who Can Benefit from This Product?
- Renewable Energy Students: Understand energy project financing and application through real-world data.
- Researchers: Utilize advanced models in academic studies and publications related to renewable energy.
- Investors: Validate your investment hypotheses and assess valuation scenarios for IREDANS (IREDANS).
- Market Analysts: Enhance your analysis process with a ready-made, adjustable DCF model.
- Entrepreneurs in the Energy Sector: Discover how established public entities like IREDANS (IREDANS) are evaluated by industry experts.
Contents of the Template
- Historical Data: Contains IREDANS' past financial records and foundational forecasts.
- DCF and Levered DCF Models: Comprehensive templates for calculating the intrinsic value of IREDANS (IREDANS).
- WACC Sheet: Pre-configured calculations for the Weighted Average Cost of Capital.
- Editable Inputs: Adjust key indicators such as growth rates, EBITDA percentages, and CAPEX estimates.
- Quarterly and Annual Statements: A thorough examination of IREDANS' financials.
- Interactive Dashboard: Dynamically visualize valuation outcomes and forecasts.
Disclaimer
All information, articles, and product details provided on this website are for general informational and educational purposes only. We do not claim any ownership over, nor do we intend to infringe upon, any trademarks, copyrights, logos, brand names, or other intellectual property mentioned or depicted on this site. Such intellectual property remains the property of its respective owners, and any references here are made solely for identification or informational purposes, without implying any affiliation, endorsement, or partnership.
We make no representations or warranties, express or implied, regarding the accuracy, completeness, or suitability of any content or products presented. Nothing on this website should be construed as legal, tax, investment, financial, medical, or other professional advice. In addition, no part of this site—including articles or product references—constitutes a solicitation, recommendation, endorsement, advertisement, or offer to buy or sell any securities, franchises, or other financial instruments, particularly in jurisdictions where such activity would be unlawful.
All content is of a general nature and may not address the specific circumstances of any individual or entity. It is not a substitute for professional advice or services. Any actions you take based on the information provided here are strictly at your own risk. You accept full responsibility for any decisions or outcomes arising from your use of this website and agree to release us from any liability in connection with your use of, or reliance upon, the content or products found herein.