
|
Valoración DCF de IRIDEX Corporation (IRIX) |
Completamente Editable: Adáptelo A Sus Necesidades En Excel O Sheets
Diseño Profesional: Plantillas Confiables Y Estándares De La Industria
Predeterminadas Para Un Uso Rápido Y Eficiente
Compatible con MAC / PC, completamente desbloqueado
No Se Necesita Experiencia; Fáciles De Seguir
IRIDEX Corporation (IRIX) Bundle
¡Explore las perspectivas financieras de Iridex Corporation (IRIX) con nuestra calculadora DCF fácil de usar! Ingrese sus suposiciones con respecto al crecimiento, los márgenes y los gastos para calcular el valor intrínseco de Iridex Corporation (IRIX) y mejorar su estrategia de inversión.
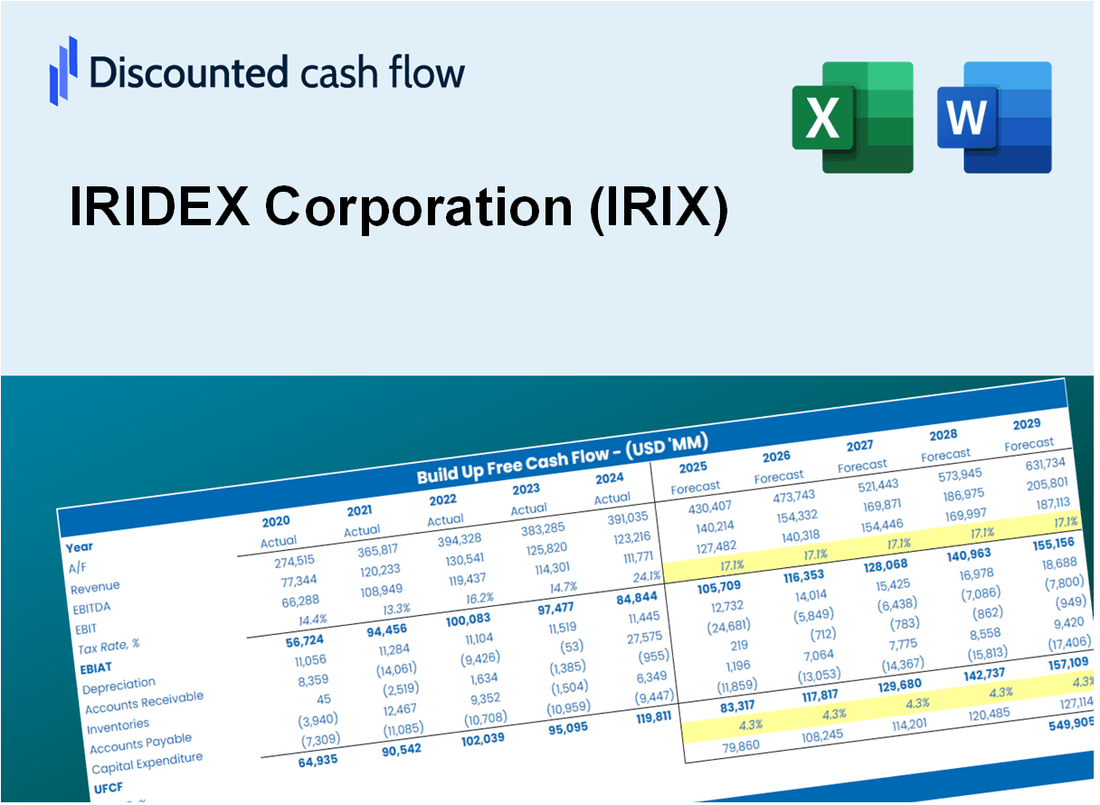
Discounted Cash Flow (DCF) - (USD MM)
| Year | AY1 2020 |
AY2 2021 |
AY3 2022 |
AY4 2023 |
AY5 2024 |
FY1 2025 |
FY2 2026 |
FY3 2027 |
FY4 2028 |
FY5 2029 |
|---|---|---|---|---|---|---|---|---|---|---|
| Revenue | 36.3 | 53.9 | 57.0 | 51.9 | 48.7 | 53.4 | 58.6 | 64.3 | 70.5 | 77.4 |
| Revenue Growth, % | 0 | 48.3 | 5.69 | -8.96 | -6.17 | 9.72 | 9.72 | 9.72 | 9.72 | 9.72 |
| EBITDA | -6.1 | -6.7 | -6.2 | -8.0 | -6.9 | -7.4 | -8.1 | -8.9 | -9.8 | -10.8 |
| EBITDA, % | -16.72 | -12.49 | -10.81 | -15.38 | -14.13 | -13.91 | -13.91 | -13.91 | -13.91 | -13.91 |
| Depreciation | .5 | .8 | 1.4 | 2.0 | 1.4 | 1.3 | 1.4 | 1.6 | 1.7 | 1.9 |
| Depreciation, % | 1.39 | 1.49 | 2.43 | 3.92 | 2.93 | 2.43 | 2.43 | 2.43 | 2.43 | 2.43 |
| EBIT | -6.6 | -7.5 | -7.5 | -10.0 | -8.3 | -8.7 | -9.6 | -10.5 | -11.5 | -12.6 |
| EBIT, % | -18.11 | -13.98 | -13.24 | -19.29 | -17.06 | -16.34 | -16.34 | -16.34 | -16.34 | -16.34 |
| Total Cash | 11.6 | 23.9 | 13.9 | 7.0 | 2.4 | 12.7 | 14.0 | 15.3 | 16.8 | 18.4 |
| Total Cash, percent | .0 | .0 | .0 | .0 | .0 | .0 | .0 | .0 | .0 | .0 |
| Account Receivables | 7.3 | 9.7 | 9.8 | 9.7 | 8.4 | 9.7 | 10.7 | 11.7 | 12.8 | 14.1 |
| Account Receivables, % | 20.05 | 18.02 | 17.15 | 18.61 | 17.25 | 18.22 | 18.22 | 18.22 | 18.22 | 18.22 |
| Inventories | 5.7 | 7.6 | 10.6 | 9.9 | 10.8 | 9.6 | 10.5 | 11.5 | 12.7 | 13.9 |
| Inventories, % | 15.72 | 14.13 | 18.62 | 19.1 | 22.23 | 17.96 | 17.96 | 17.96 | 17.96 | 17.96 |
| Accounts Payable | 1.1 | 2.8 | 3.9 | 4.5 | 7.0 | 4.1 | 4.5 | 4.9 | 5.4 | 5.9 |
| Accounts Payable, % | 3.16 | 5.14 | 6.77 | 8.67 | 14.35 | 7.62 | 7.62 | 7.62 | 7.62 | 7.62 |
| Capital Expenditure | -.1 | -.2 | -.3 | -.1 | .0 | -.1 | -.2 | -.2 | -.2 | -.2 |
| Capital Expenditure, % | -0.26687 | -0.39515 | -0.502 | -0.21014 | -0.02671105 | -0.28018 | -0.28018 | -0.28018 | -0.28018 | -0.28018 |
| Tax Rate, % | -0.76906 | -0.76906 | -0.76906 | -0.76906 | -0.76906 | -0.76906 | -0.76906 | -0.76906 | -0.76906 | -0.76906 |
| EBITAT | -6.6 | -7.6 | -7.6 | -10.1 | -8.4 | -8.7 | -9.6 | -10.5 | -11.5 | -12.6 |
| Depreciation | ||||||||||
| Changes in Account Receivables | ||||||||||
| Changes in Inventories | ||||||||||
| Changes in Accounts Payable | ||||||||||
| Capital Expenditure | ||||||||||
| UFCF | -18.1 | -9.7 | -8.5 | -6.7 | -4.1 | -10.6 | -9.8 | -10.7 | -11.8 | -12.9 |
| WACC, % | 6.14 | 6.14 | 6.14 | 6.14 | 6.14 | 6.14 | 6.14 | 6.14 | 6.14 | 6.14 |
| PV UFCF | ||||||||||
| SUM PV UFCF | -46.6 | |||||||||
| Long Term Growth Rate, % | 2.00 | |||||||||
| Free cash flow (T + 1) | -13 | |||||||||
| Terminal Value | -319 | |||||||||
| Present Terminal Value | -237 | |||||||||
| Enterprise Value | -283 | |||||||||
| Net Debt | 2 | |||||||||
| Equity Value | -286 | |||||||||
| Diluted Shares Outstanding, MM | 16 | |||||||||
| Equity Value Per Share | -17.37 |
What You Will Get
- Real IRIDEX Financial Data: Pre-filled with IRIDEX Corporation’s historical and projected data for precise analysis.
- Fully Editable Template: Modify key inputs like revenue growth, WACC, and EBITDA % with ease.
- Automatic Calculations: See IRIDEX's intrinsic value update instantly based on your changes.
- Professional Valuation Tool: Designed for investors, analysts, and consultants seeking accurate DCF results.
- User-Friendly Design: Simple structure and clear instructions for all experience levels.
Key Features
- Comprehensive IRIDEX Data: Pre-loaded with IRIDEX Corporation's historical performance metrics and future growth estimates.
- Customizable Assumptions: Modify parameters such as revenue growth rates, profit margins, discount rates, tax obligations, and capital investments.
- Interactive Valuation Framework: Real-time adjustments to Net Present Value (NPV) and intrinsic value based on user-defined inputs.
- Multiple Scenario Analysis: Develop various forecasting scenarios to evaluate different valuation results.
- Intuitive User Interface: Clean, organized design suitable for both seasoned professionals and newcomers.
How It Works
- Step 1: Download the prebuilt Excel template featuring IRIDEX Corporation's (IRIX) data.
- Step 2: Examine the pre-filled sheets to grasp the essential metrics.
- Step 3: Modify forecasts and assumptions in the editable yellow cells (WACC, growth, margins).
- Step 4: Instantly see the recalculated results, including IRIDEX Corporation's (IRIX) intrinsic value.
- Step 5: Make well-informed investment decisions or create reports based on the outputs.
Why Choose IRIDEX Corporation (IRIX)?
- Innovative Solutions: Cutting-edge technology designed to enhance patient care and outcomes.
- Proven Track Record: Established history of delivering reliable and effective medical devices.
- Commitment to Quality: Rigorous standards ensure the highest level of product performance and safety.
- Expert Support: Dedicated customer service team ready to assist with any inquiries or challenges.
- Industry Recognition: A trusted name among healthcare professionals and institutions worldwide.
Who Should Use This Product?
- Professional Investors: Develop comprehensive and accurate valuation models for analyzing portfolios involving IRIDEX Corporation (IRIX).
- Corporate Finance Teams: Evaluate valuation scenarios to inform strategic decisions within the organization.
- Consultants and Advisors: Deliver precise valuation insights to clients interested in investing in IRIDEX Corporation (IRIX).
- Students and Educators: Utilize real-world data to enhance learning and practice in financial modeling related to IRIDEX Corporation (IRIX).
- Tech Enthusiasts: Gain insights into the market valuation of tech firms like IRIDEX Corporation (IRIX).
What the Template Contains
- Pre-Filled Data: Includes IRIDEX Corporation's historical financials and forecasts.
- Discounted Cash Flow Model: Editable DCF valuation model with automatic calculations.
- Weighted Average Cost of Capital (WACC): A dedicated sheet for calculating WACC based on custom inputs.
- Key Financial Ratios: Analyze IRIDEX Corporation's profitability, efficiency, and leverage.
- Customizable Inputs: Edit revenue growth, margins, and tax rates with ease.
- Clear Dashboard: Charts and tables summarizing key valuation results.
Disclaimer
All information, articles, and product details provided on this website are for general informational and educational purposes only. We do not claim any ownership over, nor do we intend to infringe upon, any trademarks, copyrights, logos, brand names, or other intellectual property mentioned or depicted on this site. Such intellectual property remains the property of its respective owners, and any references here are made solely for identification or informational purposes, without implying any affiliation, endorsement, or partnership.
We make no representations or warranties, express or implied, regarding the accuracy, completeness, or suitability of any content or products presented. Nothing on this website should be construed as legal, tax, investment, financial, medical, or other professional advice. In addition, no part of this site—including articles or product references—constitutes a solicitation, recommendation, endorsement, advertisement, or offer to buy or sell any securities, franchises, or other financial instruments, particularly in jurisdictions where such activity would be unlawful.
All content is of a general nature and may not address the specific circumstances of any individual or entity. It is not a substitute for professional advice or services. Any actions you take based on the information provided here are strictly at your own risk. You accept full responsibility for any decisions or outcomes arising from your use of this website and agree to release us from any liability in connection with your use of, or reliance upon, the content or products found herein.