
|
Intertek Group Plc (ITRK.L) Valoración de DCF |
Completamente Editable: Adáptelo A Sus Necesidades En Excel O Sheets
Diseño Profesional: Plantillas Confiables Y Estándares De La Industria
Predeterminadas Para Un Uso Rápido Y Eficiente
Compatible con MAC / PC, completamente desbloqueado
No Se Necesita Experiencia; Fáciles De Seguir
Intertek Group plc (ITRK.L) Bundle
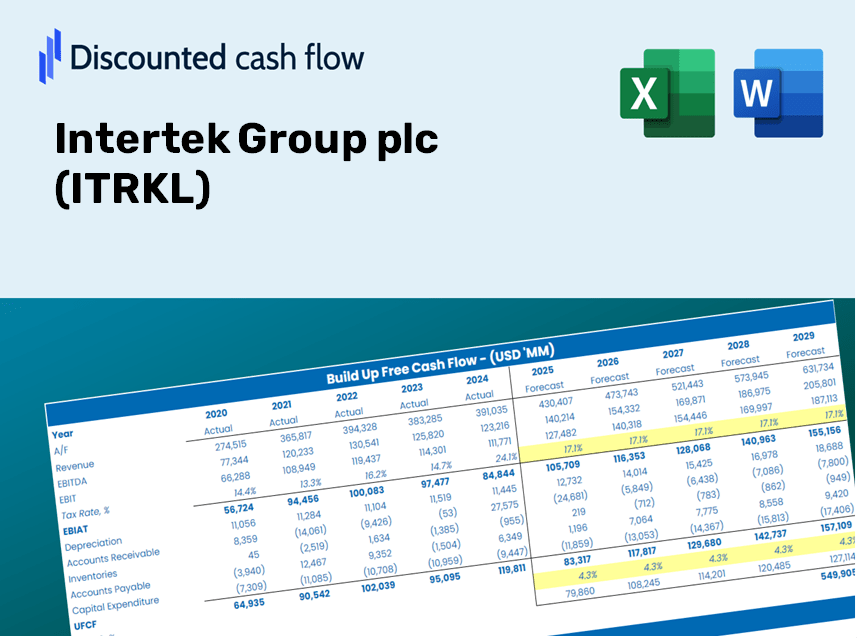
¡Evalúe las perspectivas financieras de Intertek Group plc (ITRKL) como un experto! Esta calculadora DCF (ITRKL) le proporciona finanzas prepobladas y la libertad de modificar el crecimiento de los ingresos, WACC, los márgenes y otros supuestos esenciales para alinearse con sus proyecciones.
What You Will Receive
- Genuine ITRKL Financial Data: Pre-populated with Intertek Group plc’s historical and forecasted data for accurate analysis.
- Completely Customizable Template: Easily adjust key inputs such as revenue growth, WACC, and EBITDA percentage.
- Instant Calculations: Watch Intertek’s intrinsic value update in real time as you make adjustments.
- Professional Valuation Tool: Crafted for investors, analysts, and consultants who require precise DCF results.
- User-Friendly Interface: Intuitive layout and straightforward instructions suitable for all skill levels.
Key Features
- Comprehensive Financial Data: Gain access to precise historical figures and future forecasts for Intertek Group plc (ITRKL).
- Adjustable Forecast Parameters: Modify highlighted cells for metrics such as WACC, growth rates, and profit margins.
- Real-Time Calculations: Automatic adjustments to DCF, Net Present Value (NPV), and cash flow assessments.
- Interactive Dashboard: Intuitive charts and summaries for easy visualization of your valuation insights.
- Designed for Everyone: A user-friendly framework tailored for investors, CFOs, and consultants alike.
How It Works
- Step 1: Download the customized Excel template featuring Intertek Group plc’s (ITRKL) data.
- Step 2: Review the pre-populated sheets to familiarize yourself with the essential metrics.
- Step 3: Modify forecasts and assumptions in the editable yellow cells (WACC, growth, margins).
- Step 4: Immediately view the recalibrated results, including Intertek Group plc’s (ITRKL) intrinsic value.
- Step 5: Utilize the outputs to make informed investment choices or create comprehensive reports.
Why Select the Intertek Group plc (ITRKL) Calculator?
- Precision: Utilize authentic Intertek financial data for unparalleled accuracy.
- Versatility: Crafted to allow users to experiment with and adjust inputs effortlessly.
- Efficiency: Eliminate the need to construct a DCF model from the ground up.
- Expert-Level: Engineered with the precision and usability expected by CFOs.
- Accessible: Intuitive design makes it simple for users with varying levels of financial modeling expertise.
Who Should Utilize This Product?
- Investors: Assess Intertek Group plc’s (ITRKL) valuation prior to stock transactions.
- CFOs and Financial Analysts: Optimize valuation workflows and evaluate financial forecasts.
- Startup Founders: Discover how large public entities like Intertek Group plc are valued.
- Consultants: Provide detailed valuation reports for your clients.
- Students and Educators: Employ real-world data to master and teach valuation methodologies.
Contents of the Template
- Pre-Filled Data: Contains Intertek Group plc's historical financial figures and projections.
- Discounted Cash Flow Model: An editable DCF valuation model featuring automated calculations.
- Weighted Average Cost of Capital (WACC): A specific sheet for calculating WACC using customized inputs.
- Key Financial Ratios: Assess Intertek Group plc’s profitability, efficiency, and leverage.
- Customizable Inputs: Easily modify revenue growth, margins, and tax rates.
- Clear Dashboard: Visuals and tables summarizing essential valuation outcomes.
Disclaimer
All information, articles, and product details provided on this website are for general informational and educational purposes only. We do not claim any ownership over, nor do we intend to infringe upon, any trademarks, copyrights, logos, brand names, or other intellectual property mentioned or depicted on this site. Such intellectual property remains the property of its respective owners, and any references here are made solely for identification or informational purposes, without implying any affiliation, endorsement, or partnership.
We make no representations or warranties, express or implied, regarding the accuracy, completeness, or suitability of any content or products presented. Nothing on this website should be construed as legal, tax, investment, financial, medical, or other professional advice. In addition, no part of this site—including articles or product references—constitutes a solicitation, recommendation, endorsement, advertisement, or offer to buy or sell any securities, franchises, or other financial instruments, particularly in jurisdictions where such activity would be unlawful.
All content is of a general nature and may not address the specific circumstances of any individual or entity. It is not a substitute for professional advice or services. Any actions you take based on the information provided here are strictly at your own risk. You accept full responsibility for any decisions or outcomes arising from your use of this website and agree to release us from any liability in connection with your use of, or reliance upon, the content or products found herein.