
|
Valoración de DCF IWG PLC (IWG.L) |
Completamente Editable: Adáptelo A Sus Necesidades En Excel O Sheets
Diseño Profesional: Plantillas Confiables Y Estándares De La Industria
Predeterminadas Para Un Uso Rápido Y Eficiente
Compatible con MAC / PC, completamente desbloqueado
No Se Necesita Experiencia; Fáciles De Seguir
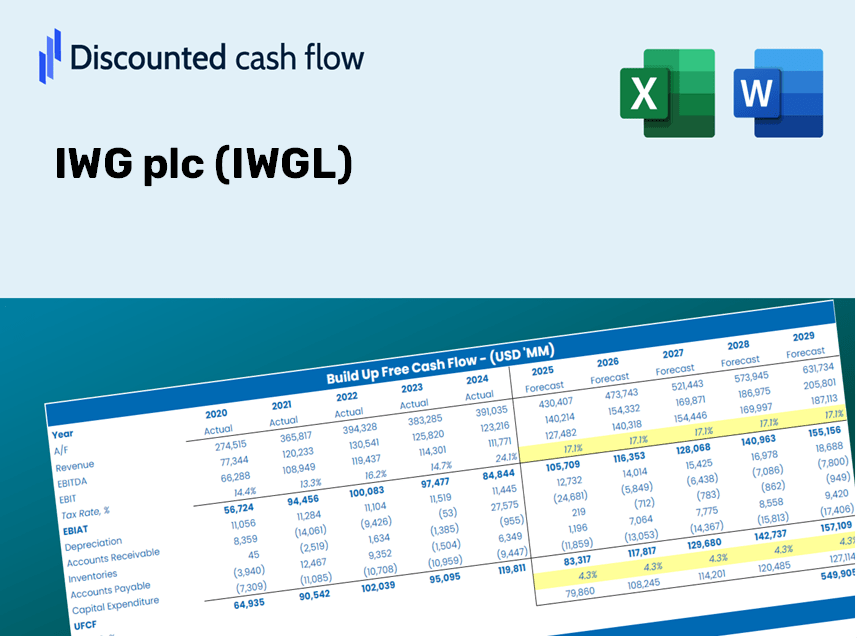
IWG plc (IWG.L) Bundle
¿Busca determinar el valor intrínseco de IWG PLC? Nuestra calculadora IWGL DCF integra datos del mundo real con características integrales de personalización, lo que le permite refinar sus pronósticos y mejorar sus opciones de inversión.
Your Benefits
- Pre-Filled Financial Model: IWG plc’s actual data facilitates accurate DCF valuation.
- Complete Forecast Control: Modify revenue growth, profit margins, WACC, and other essential drivers.
- Real-Time Calculations: Automatic updates provide immediate insights as you make adjustments.
- Investor-Ready Template: A polished Excel file crafted for high-quality valuation presentations.
- Flexible and Reusable: Designed for adaptability, allowing multiple applications for in-depth forecasts.
Key Features
- Real-Life IWG Data: Pre-loaded with IWG plc’s historical financial performance and projections for the future.
- Fully Customizable Inputs: Tailor revenue growth, profit margins, WACC, tax rates, and capital expenditures to fit your analysis.
- Dynamic Valuation Model: Instant updates to Net Present Value (NPV) and intrinsic value reflecting your specified inputs.
- Scenario Testing: Develop various forecast scenarios for assessing different valuation results.
- User-Friendly Design: Intuitive layout suitable for both experienced professionals and newcomers.
How It Operates
- 1. Access the Template: Download and open the Excel file featuring IWG plc’s (IWGL) preloaded data.
- 2. Adjust Assumptions: Modify essential inputs such as growth rates, WACC, and capital expenditures.
- 3. Immediate Results: The DCF model automatically computes intrinsic value and NPV in real-time.
- 4. Explore Scenarios: Evaluate different forecasts to understand various valuation results.
- 5. Present with Assurance: Showcase professional valuation insights to back your strategic decisions.
Why Select This Calculator for IWG plc (IWGL)?
- Precise Information: Utilizes authentic IWG financial data for dependable valuation outcomes.
- Tailorable: Modify essential variables such as growth rates, WACC, and tax rates to align with your forecasts.
- Efficiency Boost: Ready-made calculations save you from starting anew.
- Professional Tool: Crafted for investors, analysts, and consultants in the industry.
- Easy to Use: User-friendly design and comprehensive instructions make it accessible for everyone.
Who Would Benefit from This Product?
- Investors: Assess IWG plc (IWGL) valuations prior to making buy or sell decisions.
- CFOs and Financial Analysts: Optimize valuation workflows and evaluate financial forecasts.
- Startup Founders: Gain insights into how prominent public firms like IWG plc (IWGL) are appraised.
- Consultants: Provide expert valuation reports for your clientele.
- Students and Educators: Utilize real-life data for practicing and teaching valuation strategies.
Contents of the Template
- Pre-Filled DCF Model: IWG plc’s (IWGL) financial data preloaded for immediate application.
- WACC Calculator: Comprehensive calculations for Weighted Average Cost of Capital.
- Financial Ratios: Assess IWG plc’s profitability, leverage, and operational efficiency.
- Editable Inputs: Modify assumptions such as growth rates, margins, and capital expenditures to suit your analysis.
- Financial Statements: Access annual and quarterly reports for an in-depth examination.
- Interactive Dashboard: Effortlessly visualize key valuation metrics and findings.
Disclaimer
All information, articles, and product details provided on this website are for general informational and educational purposes only. We do not claim any ownership over, nor do we intend to infringe upon, any trademarks, copyrights, logos, brand names, or other intellectual property mentioned or depicted on this site. Such intellectual property remains the property of its respective owners, and any references here are made solely for identification or informational purposes, without implying any affiliation, endorsement, or partnership.
We make no representations or warranties, express or implied, regarding the accuracy, completeness, or suitability of any content or products presented. Nothing on this website should be construed as legal, tax, investment, financial, medical, or other professional advice. In addition, no part of this site—including articles or product references—constitutes a solicitation, recommendation, endorsement, advertisement, or offer to buy or sell any securities, franchises, or other financial instruments, particularly in jurisdictions where such activity would be unlawful.
All content is of a general nature and may not address the specific circumstances of any individual or entity. It is not a substitute for professional advice or services. Any actions you take based on the information provided here are strictly at your own risk. You accept full responsibility for any decisions or outcomes arising from your use of this website and agree to release us from any liability in connection with your use of, or reliance upon, the content or products found herein.