
|
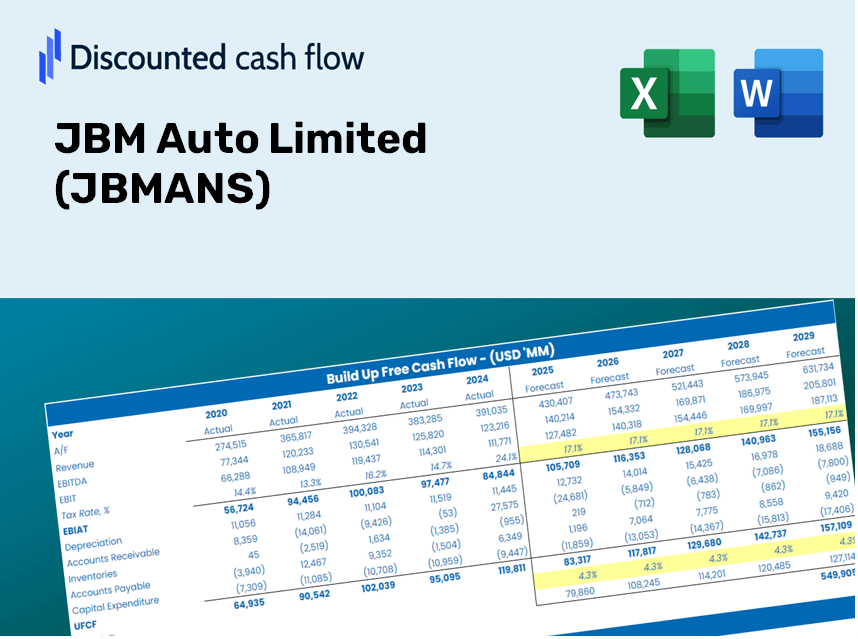
Valoración DCF de JBM Auto Limited (JBMA.NS) |
Completamente Editable: Adáptelo A Sus Necesidades En Excel O Sheets
Diseño Profesional: Plantillas Confiables Y Estándares De La Industria
Predeterminadas Para Un Uso Rápido Y Eficiente
Compatible con MAC / PC, completamente desbloqueado
No Se Necesita Experiencia; Fáciles De Seguir
JBM Auto Limited (JBMA.NS) Bundle
¡Mejore sus opciones de inversión con la calculadora DCF JBM Auto Limited (JBMANS)! Utilice datos financieros reales de JBM Auto, ajuste las proyecciones y gastos de crecimiento, y observe cómo estos cambios afectan el valor intrínseco de JBM Auto Limited (JBMAN) en tiempo real.
Discounted Cash Flow (DCF) - (USD MM)
| Year | AY1 2021 |
AY2 2022 |
AY3 2023 |
AY4 2024 |
AY5 2025 |
FY1 2026 |
FY2 2027 |
FY3 2028 |
FY4 2029 |
FY5 2030 |
|---|---|---|---|---|---|---|---|---|---|---|
| Revenue | 19,821.6 | 31,936.8 | 38,583.1 | 50,127.8 | 54,755.4 | 71,330.6 | 92,923.3 | 121,052.4 | 157,696.5 | 205,433.3 |
| Revenue Growth, % | 0 | 61.12 | 20.81 | 29.92 | 9.23 | 30.27 | 30.27 | 30.27 | 30.27 | 30.27 |
| EBITDA | 2,132.4 | 3,567.0 | 4,034.2 | 5,849.5 | 6,801.8 | 8,056.7 | 10,495.5 | 13,672.6 | 17,811.5 | 23,203.3 |
| EBITDA, % | 10.76 | 11.17 | 10.46 | 11.67 | 12.42 | 11.29 | 11.29 | 11.29 | 11.29 | 11.29 |
| Depreciation | 725.6 | 881.4 | 1,255.7 | 1,647.4 | 1,669.2 | 2,283.9 | 2,975.3 | 3,876.0 | 5,049.3 | 6,577.8 |
| Depreciation, % | 3.66 | 2.76 | 3.25 | 3.29 | 3.05 | 3.2 | 3.2 | 3.2 | 3.2 | 3.2 |
| EBIT | 1,406.8 | 2,685.6 | 2,778.5 | 4,202.1 | 5,132.7 | 5,772.7 | 7,520.2 | 9,796.6 | 12,762.2 | 16,625.5 |
| EBIT, % | 7.1 | 8.41 | 7.2 | 8.38 | 9.37 | 8.09 | 8.09 | 8.09 | 8.09 | 8.09 |
| Total Cash | 180.4 | 343.6 | 445.1 | 666.8 | 1,938.9 | 1,142.9 | 1,488.8 | 1,939.5 | 2,526.6 | 3,291.5 |
| Total Cash, percent | .0 | .0 | .0 | .0 | .0 | .0 | .0 | .0 | .0 | .0 |
| Account Receivables | 5,995.7 | 11,220.1 | 9,633.6 | 15,191.9 | 10,071.0 | 19,836.7 | 25,841.6 | 33,664.2 | 43,854.8 | 57,130.2 |
| Account Receivables, % | 30.25 | 35.13 | 24.97 | 30.31 | 18.39 | 27.81 | 27.81 | 27.81 | 27.81 | 27.81 |
| Inventories | 3,620.3 | 4,134.8 | 4,239.0 | 7,436.7 | 6,101.3 | 9,726.1 | 12,670.3 | 16,505.8 | 21,502.3 | 28,011.3 |
| Inventories, % | 18.26 | 12.95 | 10.99 | 14.84 | 11.14 | 13.64 | 13.64 | 13.64 | 13.64 | 13.64 |
| Accounts Payable | 5,840.1 | 5,614.3 | 4,364.1 | 11,028.7 | 11,665.6 | 14,502.8 | 18,893.1 | 24,612.2 | 32,062.7 | 41,768.5 |
| Accounts Payable, % | 29.46 | 17.58 | 11.31 | 22 | 21.3 | 20.33 | 20.33 | 20.33 | 20.33 | 20.33 |
| Capital Expenditure | -3,492.0 | -2,702.7 | -6,267.3 | -2,276.1 | -1,221.2 | -7,003.8 | -9,124.0 | -11,886.0 | -15,484.0 | -20,171.2 |
| Capital Expenditure, % | -17.62 | -8.46 | -16.24 | -4.54 | -2.23 | -9.82 | -9.82 | -9.82 | -9.82 | -9.82 |
| Tax Rate, % | 26.09 | 26.09 | 26.09 | 26.09 | 26.09 | 26.09 | 26.09 | 26.09 | 26.09 | 26.09 |
| EBITAT | 888.6 | 2,242.7 | 2,038.6 | 3,053.4 | 3,793.5 | 4,232.7 | 5,514.0 | 7,183.2 | 9,357.6 | 12,190.3 |
| Depreciation | ||||||||||
| Changes in Account Receivables | ||||||||||
| Changes in Inventories | ||||||||||
| Changes in Accounts Payable | ||||||||||
| Capital Expenditure | ||||||||||
| UFCF | -5,653.7 | -5,543.5 | -2,740.9 | 333.4 | 11,334.7 | -11,040.5 | -5,193.5 | -6,765.7 | -8,813.7 | -11,481.8 |
| WACC, % | 5.81 | 6.08 | 5.94 | 5.94 | 5.95 | 5.94 | 5.94 | 5.94 | 5.94 | 5.94 |
| PV UFCF | ||||||||||
| SUM PV UFCF | -36,336.4 | |||||||||
| Long Term Growth Rate, % | 4.00 | |||||||||
| Free cash flow (T + 1) | -11,941 | |||||||||
| Terminal Value | -614,246 | |||||||||
| Present Terminal Value | -460,214 | |||||||||
| Enterprise Value | -496,551 | |||||||||
| Net Debt | 23,811 | |||||||||
| Equity Value | -520,362 | |||||||||
| Diluted Shares Outstanding, MM | 236 | |||||||||
| Equity Value Per Share | -2,200.32 |
Benefits You Will Receive
- Comprehensive Financial Model: Utilize JBM Auto Limited’s actual data for accurate DCF valuation.
- Complete Forecast Flexibility: Modify revenue growth, profit margins, WACC, and other crucial drivers.
- Real-Time Calculations: Automatic updates provide immediate insights as you adjust parameters.
- Professional-Grade Template: A polished Excel file crafted for high-quality valuation.
- Adaptable and Repeatable: Designed for versatility, facilitating multiple detailed forecasts.
Key Features
- Real-Time JBM Auto Data: Pre-loaded with JBM Auto Limited's historical performance metrics and future growth projections.
- Comprehensive Customization Options: Tailor revenue growth rates, profit margins, WACC, tax estimates, and capital expenditures to fit your analysis.
- Responsive Valuation Framework: Instant recalculation of Net Present Value (NPV) and intrinsic value in response to your variable inputs.
- Scenario Analysis Capability: Develop various forecasting scenarios to evaluate diverse valuation results.
- Intuitive User Interface: Clean, organized design suitable for both seasoned professionals and newcomers.
How It Functions
- Download: Get the pre-prepared Excel file containing JBM Auto Limited's (JBMANS) financial data.
- Customize: Modify forecasts, such as revenue growth, EBITDA %, and WACC.
- Update Automatically: The intrinsic value and NPV calculations refresh in real-time.
- Test Scenarios: Develop various projections and compare results instantly.
- Make Decisions: Utilize the valuation outcomes to inform your investment strategy.
Why Opt for This Calculator?
- User-Friendly: Tailored for both novices and seasoned professionals.
- Customizable Inputs: Adjust parameters easily to suit your analysis needs.
- Real-Time Adjustments: Observe immediate updates to JBM Auto Limited’s ([JBMANS]) valuation as you modify inputs.
- Preloaded Data: Comes equipped with JBM Auto Limited’s ([JBMANS]) actual financial figures for swift assessments.
- Highly Regarded: Favored by investors and analysts for making well-informed choices.
Who Can Benefit from JBM Auto Limited (JBMANS)?
- Investors: Make informed choices with our expert-grade analysis tools.
- Financial Analysts: Streamline your workflow with our ready-to-modify financial models.
- Consultants: Effortlessly tailor our templates for impactful client presentations or reports.
- Automotive Enthusiasts: Enhance your knowledge of automotive trends and valuation methods through practical insights.
- Educators and Students: Utilize our resources as effective learning aids in automotive finance courses.
Contents of the Template
- Pre-Filled Data: Contains JBM Auto Limited's (JBMANS) historical financial information and projections.
- Discounted Cash Flow Model: An editable DCF valuation model featuring automated calculations.
- Weighted Average Cost of Capital (WACC): A specialized sheet for computing WACC with user-defined inputs.
- Key Financial Ratios: Insights into JBM Auto Limited's (JBMANS) profitability, operational efficiency, and financial leverage.
- Customizable Inputs: Easily adjust revenue growth, profit margins, and tax rates.
- Clear Dashboard: Visualizations and tables that summarize essential valuation outcomes.
Disclaimer
All information, articles, and product details provided on this website are for general informational and educational purposes only. We do not claim any ownership over, nor do we intend to infringe upon, any trademarks, copyrights, logos, brand names, or other intellectual property mentioned or depicted on this site. Such intellectual property remains the property of its respective owners, and any references here are made solely for identification or informational purposes, without implying any affiliation, endorsement, or partnership.
We make no representations or warranties, express or implied, regarding the accuracy, completeness, or suitability of any content or products presented. Nothing on this website should be construed as legal, tax, investment, financial, medical, or other professional advice. In addition, no part of this site—including articles or product references—constitutes a solicitation, recommendation, endorsement, advertisement, or offer to buy or sell any securities, franchises, or other financial instruments, particularly in jurisdictions where such activity would be unlawful.
All content is of a general nature and may not address the specific circumstances of any individual or entity. It is not a substitute for professional advice or services. Any actions you take based on the information provided here are strictly at your own risk. You accept full responsibility for any decisions or outcomes arising from your use of this website and agree to release us from any liability in connection with your use of, or reliance upon, the content or products found herein.