
|
JD Sports Fashion Plc (JD.L) Valoración de DCF |
Completamente Editable: Adáptelo A Sus Necesidades En Excel O Sheets
Diseño Profesional: Plantillas Confiables Y Estándares De La Industria
Predeterminadas Para Un Uso Rápido Y Eficiente
Compatible con MAC / PC, completamente desbloqueado
No Se Necesita Experiencia; Fáciles De Seguir
JD Sports Fashion plc (JD.L) Bundle
¡Descubra el verdadero potencial de JD Sports Fashion PLC con nuestra calculadora DCF de grado profesional! Ajuste los supuestos clave, explore varios escenarios y examine cómo los cambios afectan la valoración de JD Sports Fashion PLC, todo dentro de una sola plantilla de Excel.
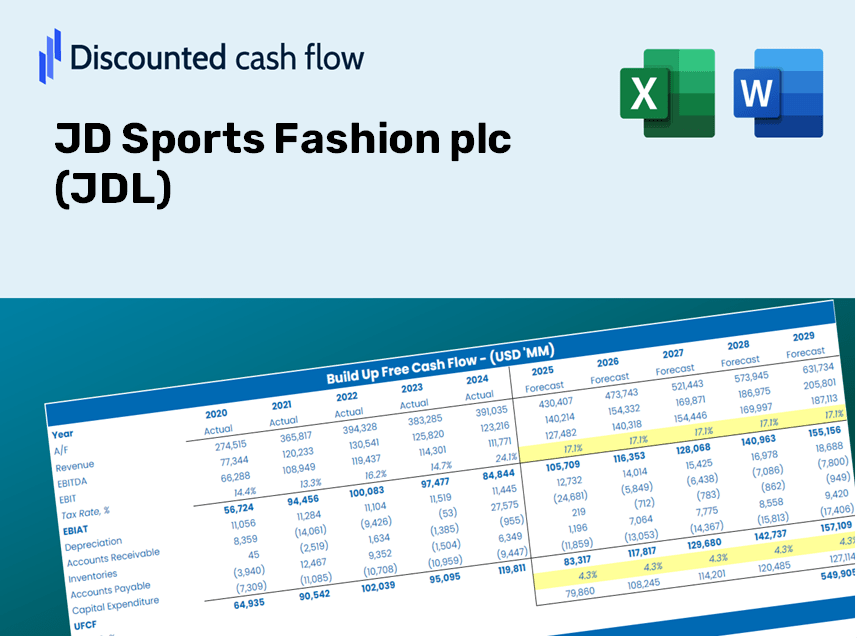
Discounted Cash Flow (DCF) - (USD MM)
| Year | AY1 2021 |
AY2 2022 |
AY3 2023 |
AY4 2024 |
AY5 2025 |
FY1 2026 |
FY2 2027 |
FY3 2028 |
FY4 2029 |
FY5 2030 |
|---|---|---|---|---|---|---|---|---|---|---|
| Revenue | 6,167.3 | 8,563.0 | 10,125.0 | 10,542.0 | 11,458.0 | 13,460.1 | 15,812.1 | 18,575.0 | 21,820.7 | 25,633.5 |
| Revenue Growth, % | 0 | 38.85 | 18.24 | 4.12 | 8.69 | 17.47 | 17.47 | 17.47 | 17.47 | 17.47 |
| EBITDA | 884.2 | 1,301.1 | 1,150.0 | 1,577.2 | 1,653.0 | 1,891.9 | 2,222.5 | 2,610.8 | 3,067.0 | 3,602.9 |
| EBITDA, % | 14.34 | 15.19 | 11.36 | 14.96 | 14.43 | 14.06 | 14.06 | 14.06 | 14.06 | 14.06 |
| Depreciation | 482.7 | 579.9 | 636.4 | 664.1 | 786.0 | 916.5 | 1,076.6 | 1,264.7 | 1,485.7 | 1,745.3 |
| Depreciation, % | 7.83 | 6.77 | 6.29 | 6.3 | 6.86 | 6.81 | 6.81 | 6.81 | 6.81 | 6.81 |
| EBIT | 401.5 | 721.2 | 513.6 | 913.1 | 867.0 | 975.4 | 1,145.8 | 1,346.1 | 1,581.3 | 1,857.6 |
| EBIT, % | 6.51 | 8.42 | 5.07 | 8.66 | 7.57 | 7.25 | 7.25 | 7.25 | 7.25 | 7.25 |
| Total Cash | 964.4 | 1,314.0 | 1,582.5 | 1,152.7 | 731.0 | 1,720.9 | 2,021.6 | 2,374.9 | 2,789.8 | 3,277.3 |
| Total Cash, percent | .0 | .0 | .0 | .0 | .0 | .0 | .0 | .0 | .0 | .0 |
| Account Receivables | 46.2 | 56.6 | 127.1 | 79.2 | 93.0 | 113.8 | 133.7 | 157.1 | 184.5 | 216.8 |
| Account Receivables, % | 0.74911 | 0.66098 | 1.26 | 0.75128 | 0.81166 | 0.84567 | 0.84567 | 0.84567 | 0.84567 | 0.84567 |
| Inventories | 813.7 | 989.4 | 1,466.4 | 1,592.7 | 2,021.0 | 1,937.7 | 2,276.2 | 2,674.0 | 3,141.2 | 3,690.1 |
| Inventories, % | 13.19 | 11.55 | 14.48 | 15.11 | 17.64 | 14.4 | 14.4 | 14.4 | 14.4 | 14.4 |
| Accounts Payable | 514.2 | 526.6 | 723.7 | 782.8 | 840.0 | 979.7 | 1,150.9 | 1,351.9 | 1,588.2 | 1,865.7 |
| Accounts Payable, % | 8.34 | 6.15 | 7.15 | 7.43 | 7.33 | 7.28 | 7.28 | 7.28 | 7.28 | 7.28 |
| Capital Expenditure | -124.3 | -247.4 | -346.5 | -529.5 | -515.0 | -480.4 | -564.3 | -662.9 | -778.8 | -914.8 |
| Capital Expenditure, % | -2.02 | -2.89 | -3.42 | -5.02 | -4.49 | -3.57 | -3.57 | -3.57 | -3.57 | -3.57 |
| Tax Rate, % | 31.47 | 31.47 | 31.47 | 31.47 | 31.47 | 31.47 | 31.47 | 31.47 | 31.47 | 31.47 |
| EBITAT | 278.0 | 407.3 | 166.0 | 606.5 | 594.2 | 571.5 | 671.4 | 788.7 | 926.5 | 1,088.4 |
| Depreciation | ||||||||||
| Changes in Account Receivables | ||||||||||
| Changes in Inventories | ||||||||||
| Changes in Accounts Payable | ||||||||||
| Capital Expenditure | ||||||||||
| UFCF | 290.7 | 566.1 | 105.5 | 721.8 | 480.3 | 1,209.8 | 996.4 | 1,170.5 | 1,375.0 | 1,615.3 |
| WACC, % | 7.45 | 7.23 | 6.8 | 7.4 | 7.44 | 7.26 | 7.26 | 7.26 | 7.26 | 7.26 |
| PV UFCF | ||||||||||
| SUM PV UFCF | 5,118.7 | |||||||||
| Long Term Growth Rate, % | 3.00 | |||||||||
| Free cash flow (T + 1) | 1,664 | |||||||||
| Terminal Value | 39,019 | |||||||||
| Present Terminal Value | 27,479 | |||||||||
| Enterprise Value | 32,598 | |||||||||
| Net Debt | 3,007 | |||||||||
| Equity Value | 29,591 | |||||||||
| Diluted Shares Outstanding, MM | 5,160 | |||||||||
| Equity Value Per Share | 573.46 |
What You Will Receive
- Authentic JD Financials: Access to both historical and projected data for precise valuation.
- Customizable Inputs: Adjust parameters such as WACC, tax rates, revenue growth, and capital expenditures.
- Automated Calculations: Intrinsic value and NPV are calculated in real-time.
- Scenario Analysis: Explore various scenarios to assess the future performance of JD Sports Fashion plc (JDL).
- User-Friendly Design: Designed with professionals in mind, yet simple enough for beginners to navigate.
Key Features
- Customizable Projections: Adjust essential parameters such as sales growth, profit margins, and investment plans.
- Instant DCF Valuation: Quickly computes intrinsic value, net present value, and additional metrics.
- High-Precision Accuracy: Utilizes JD Sports Fashion plc’s (JDL) actual financial data for authentic valuation results.
- Simplified Scenario Analysis: Effortlessly explore various assumptions and analyze different outcomes.
- Efficiency Booster: Remove the hassle of constructing intricate valuation models from the ground up.
How It Works
- Step 1: Download the Excel file.
- Step 2: Review JD Sports Fashion plc's (JDL) pre-filled financial data and forecasts.
- Step 3: Adjust key inputs such as revenue growth, WACC, and tax rates (highlighted cells).
- Step 4: Observe the DCF model updating in real time as you modify assumptions.
- Step 5: Evaluate the outputs and utilize the results for your investment decisions.
Why Opt for This Calculator?
- Precision: Utilizes accurate JD Sports financial data for reliable results.
- Adaptability: Tailored for users to easily test and adjust their inputs.
- Efficiency: Eliminate the need to create a DCF model from the ground up.
- Executive-Level Quality: Crafted with the expertise and functionality expected by finance leaders.
- Intuitive Design: Simple and accessible for anyone, regardless of financial modeling expertise.
Who Should Consider This Product?
- Professional Investors: Develop comprehensive and accurate valuation models for analyzing their portfolio with JD Sports Fashion plc (JDL).
- Corporate Finance Teams: Examine valuation scenarios to inform strategic decision-making within their organization.
- Consultants and Advisors: Deliver precise valuation insights regarding JD Sports Fashion plc (JDL) to their clients.
- Students and Educators: Utilize real-world data to enhance the learning experience in financial modeling.
- Retail Enthusiasts: Gain insights into how retail companies like JD Sports Fashion plc (JDL) are valued in the marketplace.
Contents of the Template
- Comprehensive DCF Model: An editable template featuring detailed valuation calculations.
- Real-World Data: Historical and projected financials of JD Sports Fashion plc (JDL) preloaded for thorough analysis.
- Customizable Parameters: Modify WACC, growth rates, and tax assumptions to explore different scenarios.
- Financial Statements: Complete annual and quarterly breakdowns for enhanced insights.
- Key Ratios: Integrated analysis covering profitability, efficiency, and leverage metrics.
- Dashboard with Visual Outputs: Visual representations including charts and tables for clear and actionable insights.
Disclaimer
All information, articles, and product details provided on this website are for general informational and educational purposes only. We do not claim any ownership over, nor do we intend to infringe upon, any trademarks, copyrights, logos, brand names, or other intellectual property mentioned or depicted on this site. Such intellectual property remains the property of its respective owners, and any references here are made solely for identification or informational purposes, without implying any affiliation, endorsement, or partnership.
We make no representations or warranties, express or implied, regarding the accuracy, completeness, or suitability of any content or products presented. Nothing on this website should be construed as legal, tax, investment, financial, medical, or other professional advice. In addition, no part of this site—including articles or product references—constitutes a solicitation, recommendation, endorsement, advertisement, or offer to buy or sell any securities, franchises, or other financial instruments, particularly in jurisdictions where such activity would be unlawful.
All content is of a general nature and may not address the specific circumstances of any individual or entity. It is not a substitute for professional advice or services. Any actions you take based on the information provided here are strictly at your own risk. You accept full responsibility for any decisions or outcomes arising from your use of this website and agree to release us from any liability in connection with your use of, or reliance upon, the content or products found herein.