
|
J.K. Cement Limited (JKInmem.NS) DCF Valoración |
Completamente Editable: Adáptelo A Sus Necesidades En Excel O Sheets
Diseño Profesional: Plantillas Confiables Y Estándares De La Industria
Predeterminadas Para Un Uso Rápido Y Eficiente
Compatible con MAC / PC, completamente desbloqueado
No Se Necesita Experiencia; Fáciles De Seguir
J.K. Cement Limited (JKCEMENT.NS) Bundle
Buscando evaluar el valor intrínseco de J.K. Cemento limitado? Nuestra calculadora DCF JKImemns integra datos del mundo real con extensas funciones de personalización, lo que le permite ajustar previsiones y mejorar sus estrategias de inversión.
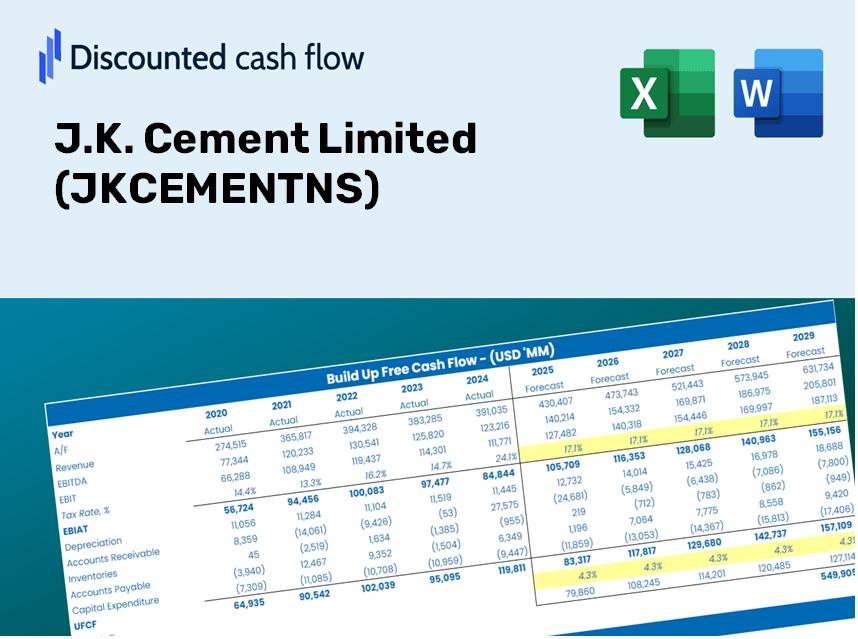
Discounted Cash Flow (DCF) - (USD MM)
| Year | AY1 2021 |
AY2 2022 |
AY3 2023 |
AY4 2024 |
AY5 2025 |
FY1 2026 |
FY2 2027 |
FY3 2028 |
FY4 2029 |
FY5 2030 |
|---|---|---|---|---|---|---|---|---|---|---|
| Revenue | 66,061.0 | 79,908.2 | 97,202.0 | 115,560.0 | 118,793.8 | 137,886.4 | 160,047.5 | 185,770.4 | 215,627.4 | 250,283.1 |
| Revenue Growth, % | 0 | 20.96 | 21.64 | 18.89 | 2.8 | 16.07 | 16.07 | 16.07 | 16.07 | 16.07 |
| EBITDA | 15,593.1 | 14,833.6 | 12,940.5 | 20,351.1 | 20,074.9 | 24,816.8 | 28,805.4 | 33,435.0 | 38,808.7 | 45,046.0 |
| EBITDA, % | 23.6 | 18.56 | 13.31 | 17.61 | 16.9 | 18 | 18 | 18 | 18 | 18 |
| Depreciation | 2,809.6 | 3,129.8 | 4,292.3 | 5,370.3 | 5,749.4 | 6,087.0 | 7,065.3 | 8,200.9 | 9,518.9 | 11,048.8 |
| Depreciation, % | 4.25 | 3.92 | 4.42 | 4.65 | 4.84 | 4.41 | 4.41 | 4.41 | 4.41 | 4.41 |
| EBIT | 12,783.5 | 11,703.8 | 8,648.2 | 14,980.8 | 14,325.5 | 18,729.8 | 21,740.1 | 25,234.1 | 29,289.8 | 33,997.2 |
| EBIT, % | 19.35 | 14.65 | 8.9 | 12.96 | 12.06 | 13.58 | 13.58 | 13.58 | 13.58 | 13.58 |
| Total Cash | 13,551.6 | 9,340.0 | 16,990.4 | 17,189.9 | 25,593.8 | 23,744.5 | 27,560.7 | 31,990.3 | 37,131.8 | 43,099.6 |
| Total Cash, percent | .0 | .0 | .0 | .0 | .0 | .0 | .0 | .0 | .0 | .0 |
| Account Receivables | 4,911.9 | 5,616.3 | 6,879.7 | 5,663.2 | 7,865.5 | 9,118.0 | 10,583.4 | 12,284.4 | 14,258.8 | 16,550.4 |
| Account Receivables, % | 7.44 | 7.03 | 7.08 | 4.9 | 6.62 | 6.61 | 6.61 | 6.61 | 6.61 | 6.61 |
| Inventories | 7,565.9 | 12,087.1 | 9,740.7 | 11,815.5 | 11,751.3 | 15,641.0 | 18,154.8 | 21,072.6 | 24,459.4 | 28,390.6 |
| Inventories, % | 11.45 | 15.13 | 10.02 | 10.22 | 9.89 | 11.34 | 11.34 | 11.34 | 11.34 | 11.34 |
| Accounts Payable | 5,997.8 | 7,151.5 | 8,221.4 | 9,310.7 | 10,977.7 | 12,074.7 | 14,015.3 | 16,267.8 | 18,882.4 | 21,917.2 |
| Accounts Payable, % | 9.08 | 8.95 | 8.46 | 8.06 | 9.24 | 8.76 | 8.76 | 8.76 | 8.76 | 8.76 |
| Capital Expenditure | -7,678.1 | -15,537.6 | -16,114.5 | -11,725.8 | -17,198.0 | -19,929.9 | -23,133.1 | -26,851.0 | -31,166.5 | -36,175.6 |
| Capital Expenditure, % | -11.62 | -19.44 | -16.58 | -10.15 | -14.48 | -14.45 | -14.45 | -14.45 | -14.45 | -14.45 |
| Tax Rate, % | 30.69 | 30.69 | 30.69 | 30.69 | 30.69 | 30.69 | 30.69 | 30.69 | 30.69 | 30.69 |
| EBITAT | 8,303.1 | 7,939.4 | 5,836.6 | 10,094.7 | 9,929.2 | 12,622.9 | 14,651.6 | 17,006.5 | 19,739.7 | 22,912.3 |
| Depreciation | ||||||||||
| Changes in Account Receivables | ||||||||||
| Changes in Inventories | ||||||||||
| Changes in Accounts Payable | ||||||||||
| Capital Expenditure | ||||||||||
| UFCF | -3,045.3 | -8,540.4 | -3,832.6 | 3,970.2 | -1,990.5 | -5,265.2 | -3,454.7 | -4,010.0 | -4,654.4 | -5,402.5 |
| WACC, % | 5.22 | 5.25 | 5.25 | 5.25 | 5.26 | 5.25 | 5.25 | 5.25 | 5.25 | 5.25 |
| PV UFCF | ||||||||||
| SUM PV UFCF | -19,538.5 | |||||||||
| Long Term Growth Rate, % | 4.00 | |||||||||
| Free cash flow (T + 1) | -5,619 | |||||||||
| Terminal Value | -450,764 | |||||||||
| Present Terminal Value | -349,070 | |||||||||
| Enterprise Value | -368,608 | |||||||||
| Net Debt | 46,586 | |||||||||
| Equity Value | -415,194 | |||||||||
| Diluted Shares Outstanding, MM | 77 | |||||||||
| Equity Value Per Share | -5,371.20 |
What You Will Receive
- Authentic J.K. Cement Data: Preloaded financial metrics – from revenue to EBIT – derived from actual and projected figures.
- Complete Customization: Modify all essential parameters (yellow cells) such as WACC, growth %, and tax rates.
- Instant Valuation Refresh: Automatic recalculations to assess the impact of adjustments on J.K. Cement's fair value.
- Flexible Excel Template: Designed for quick edits, scenario analysis, and comprehensive projections.
- Efficient and Precise: Bypass the hassle of building models from the ground up while ensuring accuracy and adaptability.
Key Features
- Customizable Forecast Variables: Adjust essential inputs such as revenue growth, EBITDA %, and capital expenditures.
- Instant DCF Valuation: Automatically computes intrinsic value, NPV, and other metrics with ease.
- Industry-Leading Precision: Leverages J.K. Cement Limited’s (JKCEMENTNS) actual financial data for accurate valuation results.
- Simplified Scenario Analysis: Effortlessly evaluate different scenarios and compare various outcomes.
- Efficiency Booster: Remove the hassle of constructing intricate valuation models from the ground up.
How It Operates
- Download: Get the pre-loaded Excel spreadsheet featuring J.K. Cement Limited's (JKCEMENTNS) financial data.
- Customize: Tailor forecasts, including revenue growth, EBITDA percentage, and WACC.
- Update Automatically: Experience real-time updates for intrinsic value and NPV calculations.
- Test Scenarios: Develop various projections and instantly compare their outcomes.
- Make Decisions: Leverage the valuation results to inform your investment approach.
Why Choose the J.K. Cement Limited (JKCEMENTNS) Calculator?
- Accuracy: Real J.K. Cement financials ensure precise data.
- Flexibility: Tailored for users to easily experiment with and adjust inputs.
- Time-Efficient: Eliminate the need to create a DCF model from the ground up.
- Professional Quality: Crafted with CFO-level accuracy and ease of use in mind.
- User-Centric: Intuitive design makes it accessible, even for those without extensive financial modeling skills.
Who Can Benefit from This Product?
- Investors: Accurately assess the fair value of J.K. Cement Limited (JKCEMENTNS) before making investment choices.
- CFOs: Utilize a professional-grade DCF model for comprehensive financial reporting and analysis.
- Consultants: Seamlessly modify the template for client valuation reports.
- Entrepreneurs: Acquire insights into the financial modeling strategies employed by leading companies.
- Educators: Employ it as a teaching resource to illustrate valuation techniques.
What the Template Includes
- Preloaded J.K. Cement Data: Historical and forecasted financial information, encompassing revenue, EBIT, and capital expenditures.
- DCF and WACC Models: Professional-grade templates for calculating intrinsic value and the Weighted Average Cost of Capital.
- Editable Inputs: Yellow-highlighted cells for modifying revenue growth, tax rates, and discount rates.
- Financial Statements: Detailed annual and quarterly financial statements for enhanced analysis.
- Key Ratios: Ratios for profitability, leverage, and efficiency to assess performance.
- Dashboard and Charts: Visual representations of valuation outcomes and underlying assumptions.
Disclaimer
All information, articles, and product details provided on this website are for general informational and educational purposes only. We do not claim any ownership over, nor do we intend to infringe upon, any trademarks, copyrights, logos, brand names, or other intellectual property mentioned or depicted on this site. Such intellectual property remains the property of its respective owners, and any references here are made solely for identification or informational purposes, without implying any affiliation, endorsement, or partnership.
We make no representations or warranties, express or implied, regarding the accuracy, completeness, or suitability of any content or products presented. Nothing on this website should be construed as legal, tax, investment, financial, medical, or other professional advice. In addition, no part of this site—including articles or product references—constitutes a solicitation, recommendation, endorsement, advertisement, or offer to buy or sell any securities, franchises, or other financial instruments, particularly in jurisdictions where such activity would be unlawful.
All content is of a general nature and may not address the specific circumstances of any individual or entity. It is not a substitute for professional advice or services. Any actions you take based on the information provided here are strictly at your own risk. You accept full responsibility for any decisions or outcomes arising from your use of this website and agree to release us from any liability in connection with your use of, or reliance upon, the content or products found herein.