
|
Just Group plc (just.l) valoración de DCF |
Completamente Editable: Adáptelo A Sus Necesidades En Excel O Sheets
Diseño Profesional: Plantillas Confiables Y Estándares De La Industria
Predeterminadas Para Un Uso Rápido Y Eficiente
Compatible con MAC / PC, completamente desbloqueado
No Se Necesita Experiencia; Fáciles De Seguir
Just Group plc (JUST.L) Bundle
¡Descubra el verdadero potencial de Just Group PLC con nuestra calculadora DCF avanzada! Ajuste los supuestos clave, explore varios escenarios y evalúe cómo los diferentes cambios afectan solo la valoración del grupo PLC, todo dentro de una sola plantilla de Excel.
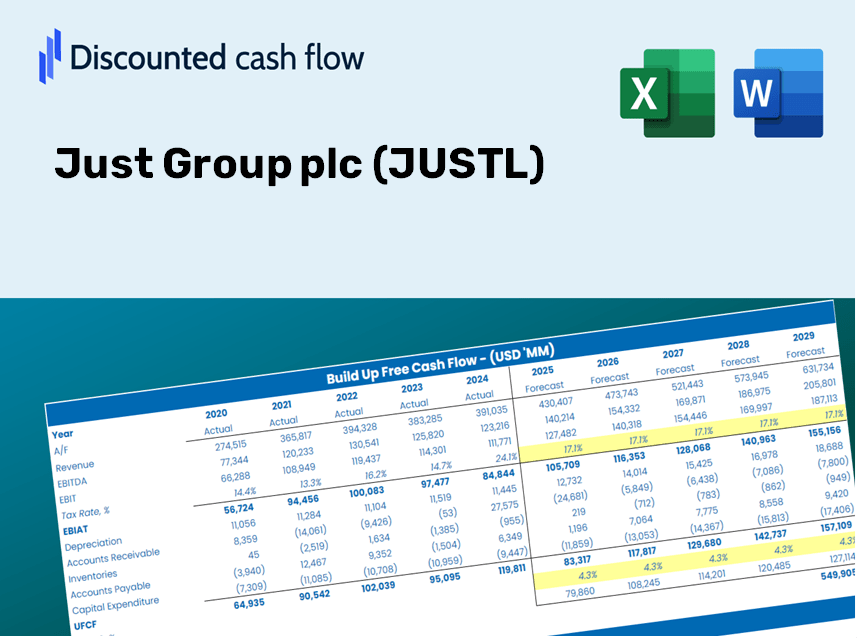
Discounted Cash Flow (DCF) - (USD MM)
| Year | AY1 2020 |
AY2 2021 |
AY3 2022 |
AY4 2023 |
AY5 2024 |
FY1 2025 |
FY2 2026 |
FY3 2027 |
FY4 2028 |
FY5 2029 |
|---|---|---|---|---|---|---|---|---|---|---|
| Revenue | 4,627.7 | 3,223.7 | 5,694.0 | 912.0 | -1,655.0 | -1,085.3 | -711.7 | -466.7 | -306.1 | -200.7 |
| Revenue Growth, % | 0 | -30.34 | 76.63 | -83.98 | -281.47 | -34.42 | -34.42 | -34.42 | -34.42 | -34.42 |
| EBITDA | 419.5 | 140.0 | -431.0 | 299.0 | 358.0 | -36.9 | -24.2 | -15.9 | -10.4 | -6.8 |
| EBITDA, % | 9.06 | 4.34 | -7.57 | 32.79 | -21.63 | 3.4 | 3.4 | 3.4 | 3.4 | 3.4 |
| Depreciation | 23.8 | 24.6 | 6.0 | 5.0 | 4.0 | -3.7 | -2.4 | -1.6 | -1.0 | -.7 |
| Depreciation, % | 0.51429 | 0.7631 | 0.10537 | 0.54825 | -0.24169 | 0.33786 | 0.33786 | 0.33786 | 0.33786 | 0.33786 |
| EBIT | 395.7 | 115.4 | -437.0 | 294.0 | 354.0 | -33.2 | -21.8 | -14.3 | -9.4 | -6.1 |
| EBIT, % | 8.55 | 3.58 | -7.67 | 32.24 | -21.39 | 3.06 | 3.06 | 3.06 | 3.06 | 3.06 |
| Total Cash | 1,498.2 | 510.0 | 1,390.0 | 1,252.0 | 1,616.0 | -162.7 | -106.7 | -70.0 | -45.9 | -30.1 |
| Total Cash, percent | .0 | .0 | .0 | .0 | .0 | .0 | .0 | .0 | .0 | .0 |
| Account Receivables | 7.2 | 41.0 | 328.4 | 60.0 | 49.0 | -23.5 | -15.4 | -10.1 | -6.6 | -4.3 |
| Account Receivables, % | 0.15558 | 1.27 | 5.77 | 6.58 | -2.96 | 2.16 | 2.16 | 2.16 | 2.16 | 2.16 |
| Inventories | .0 | .0 | .0 | .0 | -9,328.0 | -217.1 | -142.3 | -93.3 | -61.2 | -40.1 |
| Inventories, % | 0 | 0 | 0 | 0 | 563.63 | 20 | 20 | 20 | 20 | 20 |
| Accounts Payable | 24.6 | 22.0 | 31.7 | .0 | .0 | -3.8 | -2.5 | -1.7 | -1.1 | -.7 |
| Accounts Payable, % | 0.53158 | 0.68245 | 0.55673 | 0 | 0 | 0.35415 | 0.35415 | 0.35415 | 0.35415 | 0.35415 |
| Capital Expenditure | -2.4 | -7.3 | -8.1 | -3.0 | -4.0 | 1.6 | 1.1 | .7 | .5 | .3 |
| Capital Expenditure, % | -0.05186162 | -0.22645 | -0.14226 | -0.32895 | 0.24169 | -0.1499 | -0.1499 | -0.1499 | -0.1499 | -0.1499 |
| Tax Rate, % | 29.2 | 29.2 | 29.2 | 29.2 | 29.2 | 29.2 | 29.2 | 29.2 | 29.2 | 29.2 |
| EBITAT | 323.6 | 190.9 | -332.6 | 220.5 | 250.6 | -26.8 | -17.6 | -11.5 | -7.6 | -5.0 |
| Depreciation | ||||||||||
| Changes in Account Receivables | ||||||||||
| Changes in Inventories | ||||||||||
| Changes in Accounts Payable | ||||||||||
| Capital Expenditure | ||||||||||
| UFCF | 362.4 | 171.8 | -612.4 | 459.2 | 9,589.6 | -9,071.2 | -100.4 | -65.8 | -43.2 | -28.3 |
| WACC, % | 12.75 | 14.18 | 12.3 | 12.21 | 11.88 | 12.67 | 12.67 | 12.67 | 12.67 | 12.67 |
| PV UFCF | ||||||||||
| SUM PV UFCF | -8,219.0 | |||||||||
| Long Term Growth Rate, % | 2.00 | |||||||||
| Free cash flow (T + 1) | -29 | |||||||||
| Terminal Value | -271 | |||||||||
| Present Terminal Value | -149 | |||||||||
| Enterprise Value | -8,368 | |||||||||
| Net Debt | -770 | |||||||||
| Equity Value | -7,598 | |||||||||
| Diluted Shares Outstanding, MM | 1,040 | |||||||||
| Equity Value Per Share | -730.59 |
What You Will Receive
- Authentic JUST Financial Data: Pre-filled with Just Group plc’s historical and forecasted data for detailed analysis.
- Customizable Template: Effortlessly adjust key variables such as revenue growth, WACC, and EBITDA %.
- Instant Calculations: Watch the intrinsic value of Just Group plc update in real time as you make adjustments.
- Professional Valuation Tool: Tailored for investors, analysts, and consultants aiming for precise DCF outcomes.
- Intuitive Design: Streamlined layout and straightforward instructions suitable for all skill levels.
Key Features
- Comprehensive Historical Data: Just Group plc's past financial statements and pre-filled forecasts.
- Customizable Inputs: Modify WACC, tax rates, revenue growth, and EBITDA margins as needed.
- Real-Time Results: Observe Just Group plc's intrinsic value recalculating instantly.
- Visual Performance Metrics: Dashboard charts present valuation outcomes and essential metrics clearly.
- Designed for Precision: A trusted tool for analysts, investors, and finance professionals.
How It Functions
- Download: Obtain the pre-prepared Excel file featuring Just Group plc’s (JUSTL) financial data.
- Customize: Tailor forecasts such as revenue growth, EBITDA %, and WACC to fit your needs.
- Update Automatically: Enjoy real-time updates for intrinsic value and NPV calculations.
- Test Scenarios: Generate various projections and instantly compare the results.
- Make Decisions: Leverage the valuation findings to inform your investment choices.
Why Opt for Just Group plc (JUSTL) Calculator?
- Precision: Accurate data derived from genuine Just Group financials.
- Versatility: Tailored for users to freely experiment with and adjust inputs.
- Efficiency: Eliminate the need to create a DCF model from the ground up.
- Expert-Quality: Crafted with the meticulousness and usability expected at the CFO level.
- Intuitive: Simple to navigate, making it accessible for those without extensive financial modeling knowledge.
Who Can Benefit from This Product?
- Finance Students: Master valuation techniques and apply them to real-world data.
- Academics: Integrate professional valuation models into your research or coursework.
- Investors: Validate your investment hypotheses and examine valuation results for Just Group plc (JUSTL).
- Analysts: Enhance your efficiency with a customizable, ready-to-use DCF model.
- Small Business Owners: Discover how major public companies like Just Group plc (JUSTL) are evaluated and analyzed.
Contents of the Template
- Pre-Filled Data: Contains historical financial performance and forecasts for Just Group plc (JUSTL).
- Discounted Cash Flow Model: An editable DCF valuation model with automatic calculation features.
- Weighted Average Cost of Capital (WACC): A dedicated sheet for WACC calculation based on user-defined inputs.
- Key Financial Ratios: Examine Just Group’s profitability, efficiency, and financial leverage.
- Customizable Inputs: Easily modify revenue growth rates, margins, and tax rates.
- Clear Dashboard: Visual representations through charts and tables summarizing essential valuation outcomes.
Disclaimer
All information, articles, and product details provided on this website are for general informational and educational purposes only. We do not claim any ownership over, nor do we intend to infringe upon, any trademarks, copyrights, logos, brand names, or other intellectual property mentioned or depicted on this site. Such intellectual property remains the property of its respective owners, and any references here are made solely for identification or informational purposes, without implying any affiliation, endorsement, or partnership.
We make no representations or warranties, express or implied, regarding the accuracy, completeness, or suitability of any content or products presented. Nothing on this website should be construed as legal, tax, investment, financial, medical, or other professional advice. In addition, no part of this site—including articles or product references—constitutes a solicitation, recommendation, endorsement, advertisement, or offer to buy or sell any securities, franchises, or other financial instruments, particularly in jurisdictions where such activity would be unlawful.
All content is of a general nature and may not address the specific circumstances of any individual or entity. It is not a substitute for professional advice or services. Any actions you take based on the information provided here are strictly at your own risk. You accept full responsibility for any decisions or outcomes arising from your use of this website and agree to release us from any liability in connection with your use of, or reliance upon, the content or products found herein.