
|
Valoración DCF de KAR Auction Services, Inc. (KAR) |
Completamente Editable: Adáptelo A Sus Necesidades En Excel O Sheets
Diseño Profesional: Plantillas Confiables Y Estándares De La Industria
Predeterminadas Para Un Uso Rápido Y Eficiente
Compatible con MAC / PC, completamente desbloqueado
No Se Necesita Experiencia; Fáciles De Seguir
KAR Auction Services, Inc. (KAR) Bundle
¡Descubra el verdadero potencial de Kar Auction Services, Inc. (KAR) con nuestra calculadora DCF avanzada! Ajuste los supuestos clave, explore varios escenarios y evalúe cómo las modificaciones afectan la valoración de Kar, todo dentro de una sola plantilla de Excel.
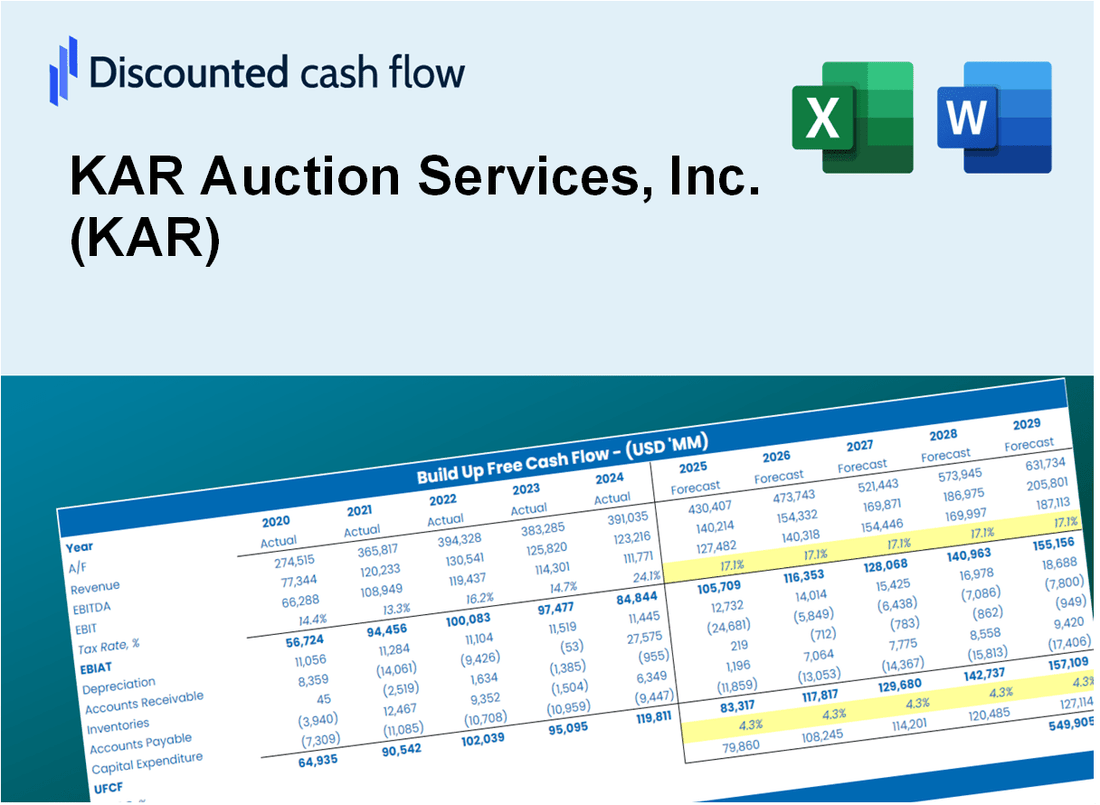
Discounted Cash Flow (DCF) - (USD MM)
| Year | AY1 2020 |
AY2 2021 |
AY3 2022 |
AY4 2023 |
AY5 2024 |
FY1 2025 |
FY2 2026 |
FY3 2027 |
FY4 2028 |
FY5 2029 |
|---|---|---|---|---|---|---|---|---|---|---|
| Revenue | 1,326.9 | 1,450.6 | 1,529.2 | 1,645.1 | 1,788.5 | 1,927.3 | 2,076.8 | 2,238.0 | 2,411.6 | 2,598.7 |
| Revenue Growth, % | 0 | 9.32 | 5.42 | 7.58 | 8.72 | 7.76 | 7.76 | 7.76 | 7.76 | 7.76 |
| EBITDA | 172.5 | 249.9 | 179.0 | 110.8 | 274.9 | 246.8 | 266.0 | 286.6 | 308.9 | 332.8 |
| EBITDA, % | 13 | 17.23 | 11.71 | 6.74 | 15.37 | 12.81 | 12.81 | 12.81 | 12.81 | 12.81 |
| Depreciation | 109.1 | 109.9 | 100.2 | 101.5 | 95.2 | 130.5 | 140.6 | 151.5 | 163.2 | 175.9 |
| Depreciation, % | 8.22 | 7.58 | 6.55 | 6.17 | 5.32 | 6.77 | 6.77 | 6.77 | 6.77 | 6.77 |
| EBIT | 63.4 | 140.0 | 78.8 | 9.3 | 179.7 | 116.4 | 125.4 | 135.2 | 145.6 | 156.9 |
| EBIT, % | 4.78 | 9.65 | 5.15 | 0.56532 | 10.05 | 6.04 | 6.04 | 6.04 | 6.04 | 6.04 |
| Total Cash | 752.1 | 177.6 | 225.7 | 93.5 | 143.0 | 375.3 | 404.4 | 435.8 | 469.6 | 506.0 |
| Total Cash, percent | .0 | .0 | .0 | .0 | .0 | .0 | .0 | .0 | .0 | .0 |
| Account Receivables | 2,256.2 | 2,887.3 | 2,665.8 | 2,573.8 | 2,570.9 | 1,927.3 | 2,076.8 | 2,238.0 | 2,411.6 | 2,598.7 |
| Account Receivables, % | 170.04 | 199.04 | 174.33 | 156.45 | 143.75 | 100 | 100 | 100 | 100 | 100 |
| Inventories | .0 | .0 | .0 | .0 | .0 | .0 | .0 | .0 | .0 | .0 |
| Inventories, % | 0 | 0 | 0 | 0 | 0 | 0 | 0 | 0 | 0 | 0 |
| Accounts Payable | 688.9 | 785.3 | 551.2 | 556.6 | 547.6 | 796.2 | 857.9 | 924.5 | 996.2 | 1,073.5 |
| Accounts Payable, % | 51.92 | 54.14 | 36.04 | 33.83 | 30.62 | 41.31 | 41.31 | 41.31 | 41.31 | 41.31 |
| Capital Expenditure | -101.4 | -108.5 | -60.9 | -52.0 | -53.0 | -97.2 | -104.8 | -112.9 | -121.7 | -131.1 |
| Capital Expenditure, % | -7.64 | -7.48 | -3.98 | -3.16 | -2.96 | -5.05 | -5.05 | -5.05 | -5.05 | -5.05 |
| Tax Rate, % | 30.4 | 30.4 | 30.4 | 30.4 | 30.4 | 30.4 | 30.4 | 30.4 | 30.4 | 30.4 |
| EBITAT | -.5 | 651.0 | 492.4 | 9.8 | 125.1 | 86.0 | 92.7 | 99.9 | 107.7 | 116.0 |
| Depreciation | ||||||||||
| Changes in Account Receivables | ||||||||||
| Changes in Inventories | ||||||||||
| Changes in Accounts Payable | ||||||||||
| Capital Expenditure | ||||||||||
| UFCF | -1,560.1 | 117.7 | 519.1 | 156.7 | 161.2 | 1,011.4 | 40.7 | 43.9 | 47.3 | 51.0 |
| WACC, % | 8.76 | 9.46 | 9.46 | 9.46 | 9.25 | 9.28 | 9.28 | 9.28 | 9.28 | 9.28 |
| PV UFCF | ||||||||||
| SUM PV UFCF | 1,059.2 | |||||||||
| Long Term Growth Rate, % | 2.00 | |||||||||
| Free cash flow (T + 1) | 52 | |||||||||
| Terminal Value | 714 | |||||||||
| Present Terminal Value | 458 | |||||||||
| Enterprise Value | 1,518 | |||||||||
| Net Debt | 140 | |||||||||
| Equity Value | 1,378 | |||||||||
| Diluted Shares Outstanding, MM | 109 | |||||||||
| Equity Value Per Share | 12.64 |
What You Will Get
- Real KAR Data: Preloaded financials – from revenue to EBIT – based on actual and projected figures for KAR Auction Services, Inc. (KAR).
- Full Customization: Adjust all critical parameters (yellow cells) like WACC, growth %, and tax rates specific to KAR.
- Instant Valuation Updates: Automatic recalculations to analyze the impact of changes on KAR’s fair value.
- Versatile Excel Template: Tailored for quick edits, scenario testing, and detailed projections for KAR Auction Services, Inc. (KAR).
- Time-Saving and Accurate: Skip building models from scratch while maintaining precision and flexibility in your analysis of KAR.
Key Features
- Comprehensive Market Data: Gain access to reliable pre-loaded historical figures and future forecasts for KAR Auction Services, Inc. (KAR).
- Adjustable Forecast Parameters: Modify highlighted fields such as discount rates, growth projections, and profit margins.
- Real-Time Calculations: Automatic adjustments for DCF, Net Present Value (NPV), and cash flow evaluations.
- User-Friendly Dashboard: Clear and informative charts and summaries to help visualize your valuation outcomes.
- Designed for All Skill Levels: An intuitive layout tailored for investors, financial officers, and consultants alike.
How It Works
- Step 1: Download the Excel file.
- Step 2: Review pre-entered KAR Auction Services data (historical and projected).
- Step 3: Adjust key assumptions (yellow cells) based on your analysis.
- Step 4: View automatic recalculations for KAR's intrinsic value.
- Step 5: Use the outputs for investment decisions or reporting.
Why Choose This Calculator for KAR Auction Services, Inc. (KAR)?
- All-in-One Solution: Combines DCF, WACC, and comprehensive financial ratio analyses tailored for KAR.
- Flexible Inputs: Modify yellow-highlighted fields to explore different financial scenarios for KAR.
- In-Depth Analysis: Automatically computes KAR’s intrinsic value and Net Present Value for informed decision-making.
- Rich Data Set: Comes with historical and projected data to provide accurate benchmarks for KAR.
- Expert Level: Perfect for financial analysts, investors, and consultants focusing on KAR Auction Services.
Who Should Use This Product?
- Auto Industry Students: Understand auction processes and apply them using real market data.
- Researchers: Integrate industry-specific models into academic studies or papers.
- Investors: Evaluate your investment strategies and analyze auction outcomes for KAR Auction Services, Inc. (KAR).
- Market Analysts: Enhance your analysis with a customizable auction valuation model.
- Dealership Owners: Learn how large auction companies like KAR are evaluated in the market.
What the Template Contains
- Historical Data: Includes KAR Auction Services, Inc.’s (KAR) past financials and baseline forecasts.
- DCF and Levered DCF Models: Detailed templates to calculate KAR’s intrinsic value.
- WACC Sheet: Pre-built calculations for Weighted Average Cost of Capital.
- Editable Inputs: Modify key drivers like growth rates, EBITDA %, and CAPEX assumptions.
- Quarterly and Annual Statements: A complete breakdown of KAR’s financials.
- Interactive Dashboard: Visualize valuation results and projections dynamically.
Disclaimer
All information, articles, and product details provided on this website are for general informational and educational purposes only. We do not claim any ownership over, nor do we intend to infringe upon, any trademarks, copyrights, logos, brand names, or other intellectual property mentioned or depicted on this site. Such intellectual property remains the property of its respective owners, and any references here are made solely for identification or informational purposes, without implying any affiliation, endorsement, or partnership.
We make no representations or warranties, express or implied, regarding the accuracy, completeness, or suitability of any content or products presented. Nothing on this website should be construed as legal, tax, investment, financial, medical, or other professional advice. In addition, no part of this site—including articles or product references—constitutes a solicitation, recommendation, endorsement, advertisement, or offer to buy or sell any securities, franchises, or other financial instruments, particularly in jurisdictions where such activity would be unlawful.
All content is of a general nature and may not address the specific circumstances of any individual or entity. It is not a substitute for professional advice or services. Any actions you take based on the information provided here are strictly at your own risk. You accept full responsibility for any decisions or outcomes arising from your use of this website and agree to release us from any liability in connection with your use of, or reliance upon, the content or products found herein.