
|
KBC Ancora SCA (KBCA.BR) DCF Valoración |
Completamente Editable: Adáptelo A Sus Necesidades En Excel O Sheets
Diseño Profesional: Plantillas Confiables Y Estándares De La Industria
Predeterminadas Para Un Uso Rápido Y Eficiente
Compatible con MAC / PC, completamente desbloqueado
No Se Necesita Experiencia; Fáciles De Seguir
KBC Ancora SCA (KBCA.BR) Bundle
¡Agilice su análisis y aumente la precisión con nuestra calculadora DCF (KBCABR)! Utilizando datos reales de KBC Ancora SCA y supuestos personalizables, esta herramienta le permite pronosticar, analizar y evaluar KBC Ancora como un inversor experimentado.
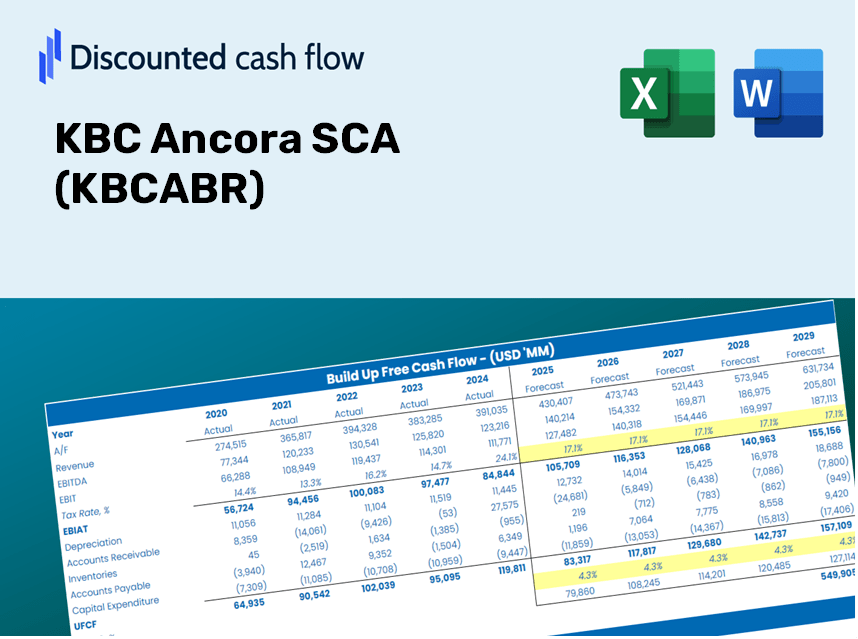
Discounted Cash Flow (DCF) - (USD MM)
| Year | AY1 2019 |
AY2 2020 |
AY3 2021 |
AY4 2022 |
AY5 2023 |
FY1 2024 |
FY2 2025 |
FY3 2026 |
FY4 2027 |
FY5 2028 |
|---|---|---|---|---|---|---|---|---|---|---|
| Revenue | .0 | .1 | .0 | .0 | 378.3 | 415.7 | 456.7 | 501.9 | 551.4 | 605.9 |
| Revenue Growth, % | 0 | 21.33 | -28.48 | -53.33 | 2082457.23 | 9.88 | 9.88 | 9.88 | 9.88 | 9.88 |
| EBITDA | .0 | .0 | .0 | .0 | 375.1 | 82.4 | 90.6 | 99.5 | 109.4 | 120.2 |
| EBITDA, % | 0 | 0 | 0 | 0 | 99.15 | 19.83 | 19.83 | 19.83 | 19.83 | 19.83 |
| Depreciation | 2.2 | 2.3 | 3.2 | 3.0 | 3.2 | 333.2 | 366.2 | 402.3 | 442.1 | 485.8 |
| Depreciation, % | 4900.75 | 4285.31 | 8289.51 | 16653.53 | 0.84339 | 80.17 | 80.17 | 80.17 | 80.17 | 80.17 |
| EBIT | -2.2 | -2.3 | -3.2 | -3.0 | 371.9 | -250.8 | -275.6 | -302.8 | -332.7 | -365.6 |
| EBIT, % | -4900.75 | -4285.31 | -8289.51 | -16653.53 | 98.31 | -60.34 | -60.34 | -60.34 | -60.34 | -60.34 |
| Total Cash | 62.0 | 64.3 | 75.9 | 4.1 | .0 | 332.5 | 365.4 | 401.5 | 441.2 | 484.7 |
| Total Cash, percent | .1 | .1 | .2 | .0 | .0 | .0 | .0 | .0 | .0 | .0 |
| Account Receivables | .0 | .0 | .0 | .0 | .0 | 100.4 | 110.3 | 121.2 | 133.2 | 146.4 |
| Account Receivables, % | 22.02 | 19.73 | 29.65 | 49.38 | 0.00179129 | 24.16 | 24.16 | 24.16 | 24.16 | 24.16 |
| Inventories | .0 | .0 | .0 | .0 | .0 | .0 | .0 | .0 | .0 | .0 |
| Inventories, % | 0 | 0 | 0 | 0 | 0 | 0 | 0 | 0 | 0 | 0 |
| Accounts Payable | .2 | .2 | .2 | .2 | .2 | 332.6 | 365.4 | 401.5 | 441.2 | 484.8 |
| Accounts Payable, % | 358.52 | 308.56 | 399.22 | 1002.72 | 0.04586337 | 80.01 | 80.01 | 80.01 | 80.01 | 80.01 |
| Capital Expenditure | .0 | .0 | .0 | .0 | .0 | .0 | .0 | .0 | .0 | .0 |
| Capital Expenditure, % | 0 | 0 | 0 | 0 | 0 | 0 | 0 | 0 | 0 | 0 |
| Tax Rate, % | 0 | 0 | 0 | 0 | 0 | 0 | 0 | 0 | 0 | 0 |
| EBITAT | -2.2 | -2.3 | -3.2 | -3.0 | 371.9 | -250.8 | -275.6 | -302.8 | -332.7 | -365.6 |
| Depreciation | ||||||||||
| Changes in Account Receivables | ||||||||||
| Changes in Inventories | ||||||||||
| Changes in Accounts Payable | ||||||||||
| Capital Expenditure | ||||||||||
| UFCF | .2 | .0 | .0 | .0 | 375.1 | 314.4 | 113.5 | 124.7 | 137.1 | 150.6 |
| WACC, % | 8.6 | 8.6 | 8.6 | 8.6 | 8.6 | 8.6 | 8.6 | 8.6 | 8.6 | 8.6 |
| PV UFCF | ||||||||||
| SUM PV UFCF | 681.3 | |||||||||
| Long Term Growth Rate, % | 2.00 | |||||||||
| Free cash flow (T + 1) | 154 | |||||||||
| Terminal Value | 2,326 | |||||||||
| Present Terminal Value | 1,540 | |||||||||
| Enterprise Value | 2,221 | |||||||||
| Net Debt | 116 | |||||||||
| Equity Value | 2,105 | |||||||||
| Diluted Shares Outstanding, MM | 77 | |||||||||
| Equity Value Per Share | 27.34 |
What You Will Receive
- Authentic KBC Ancora Financial Data: Pre-filled with KBC Ancora's historical and projected figures for accurate analysis.
- Completely Customizable Template: Easily adjust key inputs such as revenue growth, WACC, and EBITDA %.
- Instantaneous Calculations: Witness KBC Ancora's intrinsic value update in real-time as you make adjustments.
- Expert Valuation Tool: Tailored for investors, analysts, and consultants seeking precise DCF results.
- Intuitive User Interface: Streamlined layout and straightforward instructions suitable for users of all experience levels.
Key Features
- Customizable Forecast Inputs: Adjust essential parameters such as revenue growth, EBITDA percentage, and capital expenditure.
- Instant DCF Valuation: Quickly calculates intrinsic value, NPV, and additional metrics.
- High Precision Accuracy: Leverages KBC Ancora's real financial data for dependable valuation results.
- User-Friendly Scenario Analysis: Effortlessly evaluate different assumptions and analyze their outcomes.
- Efficiency Boosting Tool: Remove the hassle of creating intricate valuation models from the ground up.
How It Works
- 1. Access the Template: Download and open the Excel file containing KBC Ancora SCA’s preloaded data.
- 2. Adjust Assumptions: Modify essential inputs such as growth rates, WACC, and capital expenditures.
- 3. View Results Instantly: The DCF model automatically calculates intrinsic value and NPV for [KBCABR].
- 4. Explore Scenarios: Evaluate multiple forecasts to assess various valuation outcomes.
- 5. Utilize with Assurance: Present expert valuation insights to enhance your decision-making process.
Why Choose This KBC Ancora SCA (KBCABR) Calculator?
- Accurate Data: Reliable financial figures provide trustworthy valuation results for KBC Ancora SCA.
- Customizable: Tailor key variables such as growth projections, WACC, and tax rates to suit your forecasts.
- Time-Saving: Pre-configured calculations streamline the process, saving you from starting from scratch.
- Professional-Grade Tool: Crafted for investors, analysts, and consultants focused on KBC Ancora SCA.
- User-Friendly: Designed with an intuitive interface and clear instructions, making it accessible for everyone.
Who Can Benefit from KBC Ancora SCA (KBCABR)?
- Investors: Make informed choices with a robust, professional valuation tool.
- Financial Analysts: Increase efficiency with a customizable pre-built DCF model.
- Consultants: Seamlessly modify the template for client reports or presentations.
- Finance Enthusiasts: Enhance your knowledge of valuation methods through real-world scenarios.
- Educators and Students: Utilize it as an interactive learning resource in finance courses.
Contents of the Template
- Operating and Balance Sheet Data: Pre-filled historical data and forecasts for KBC Ancora SCA (KBCABR), including metrics such as revenue, EBITDA, EBIT, and capital expenditures.
- WACC Calculation: A dedicated sheet for the Weighted Average Cost of Capital (WACC), featuring parameters like Beta, risk-free rate, and share price.
- DCF Valuation (Unlevered and Levered): Customizable Discounted Cash Flow models that display intrinsic value along with detailed calculations.
- Financial Statements: Pre-loaded financial statements (annual and quarterly) to facilitate analysis.
- Key Ratios: Provides profitability, leverage, and efficiency ratios specific to KBC Ancora SCA (KBCABR).
- Dashboard and Charts: Visual overview of valuation outputs and assumptions for straightforward result analysis.
Disclaimer
All information, articles, and product details provided on this website are for general informational and educational purposes only. We do not claim any ownership over, nor do we intend to infringe upon, any trademarks, copyrights, logos, brand names, or other intellectual property mentioned or depicted on this site. Such intellectual property remains the property of its respective owners, and any references here are made solely for identification or informational purposes, without implying any affiliation, endorsement, or partnership.
We make no representations or warranties, express or implied, regarding the accuracy, completeness, or suitability of any content or products presented. Nothing on this website should be construed as legal, tax, investment, financial, medical, or other professional advice. In addition, no part of this site—including articles or product references—constitutes a solicitation, recommendation, endorsement, advertisement, or offer to buy or sell any securities, franchises, or other financial instruments, particularly in jurisdictions where such activity would be unlawful.
All content is of a general nature and may not address the specific circumstances of any individual or entity. It is not a substitute for professional advice or services. Any actions you take based on the information provided here are strictly at your own risk. You accept full responsibility for any decisions or outcomes arising from your use of this website and agree to release us from any liability in connection with your use of, or reliance upon, the content or products found herein.