
|
Valoración DCF de Kenon Holdings Ltd. (KEN) |
Completamente Editable: Adáptelo A Sus Necesidades En Excel O Sheets
Diseño Profesional: Plantillas Confiables Y Estándares De La Industria
Predeterminadas Para Un Uso Rápido Y Eficiente
Compatible con MAC / PC, completamente desbloqueado
No Se Necesita Experiencia; Fáciles De Seguir
Kenon Holdings Ltd. (KEN) Bundle
¡Simplifique la valoración de Kenon Holdings Ltd. (Ken) con esta calculadora DCF personalizable! Con el Real Kenon Holdings Ltd. (Ken) Financials y las entradas de pronóstico ajustable, puede probar escenarios y descubrir el valor razonable de Kenon Holdings Ltd. (Ken) en minutos.
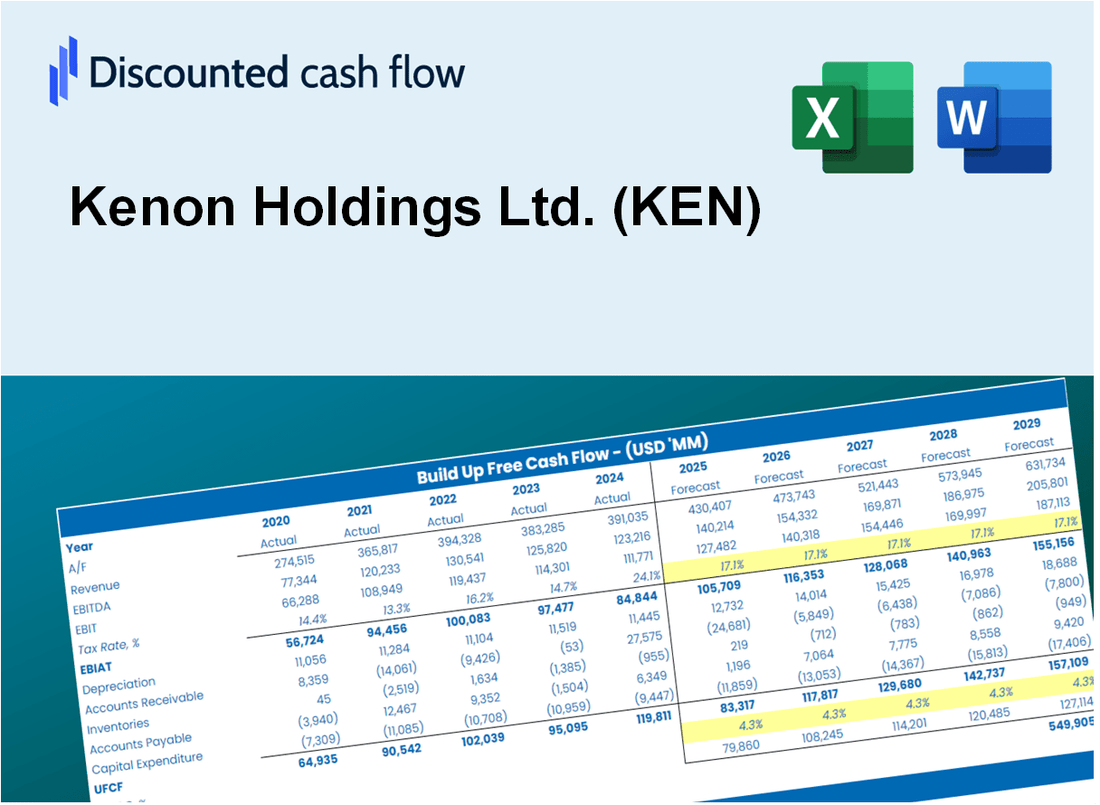
Discounted Cash Flow (DCF) - (USD MM)
| Year | AY1 2020 |
AY2 2021 |
AY3 2022 |
AY4 2023 |
AY5 2024 |
FY1 2025 |
FY2 2026 |
FY3 2027 |
FY4 2028 |
FY5 2029 |
|---|---|---|---|---|---|---|---|---|---|---|
| Revenue | 386.0 | 487.8 | 574.0 | 691.8 | 751.3 | 888.7 | 1,051.3 | 1,243.6 | 1,471.1 | 1,740.2 |
| Revenue Growth, % | 0 | 26.36 | 17.68 | 20.52 | 8.6 | 18.29 | 18.29 | 18.29 | 18.29 | 18.29 |
| EBITDA | 69.4 | 80.9 | -620.1 | 224.4 | 234.0 | -3.3 | -3.9 | -4.6 | -5.4 | -6.4 |
| EBITDA, % | 17.98 | 16.59 | -108.03 | 32.44 | 31.14 | -0.36931 | -0.36931 | -0.36931 | -0.36931 | -0.36931 |
| Depreciation | 34.2 | 57.6 | 62.9 | 90.9 | 93.4 | 101.7 | 120.3 | 142.3 | 168.3 | 199.1 |
| Depreciation, % | 8.85 | 11.82 | 10.95 | 13.15 | 12.44 | 11.44 | 11.44 | 11.44 | 11.44 | 11.44 |
| EBIT | 35.2 | 23.3 | -683.0 | 133.5 | 140.5 | -85.5 | -101.1 | -119.6 | -141.5 | -167.4 |
| EBIT, % | 9.13 | 4.78 | -118.99 | 19.29 | 18.7 | -9.62 | -9.62 | -9.62 | -9.62 | -9.62 |
| Total Cash | 286.0 | 474.8 | 926.0 | 912.6 | 1,158.5 | 837.9 | 991.2 | 1,172.5 | 1,387.0 | 1,640.7 |
| Total Cash, percent | .0 | .0 | .0 | .0 | .0 | .0 | .0 | .0 | .0 | .0 |
| Account Receivables | 57.0 | 76.7 | 78.6 | 150.8 | 90.9 | 138.8 | 164.2 | 194.2 | 229.7 | 271.7 |
| Account Receivables, % | 14.77 | 15.73 | 13.69 | 21.8 | 12.1 | 15.62 | 15.62 | 15.62 | 15.62 | 15.62 |
| Inventories | 564.0 | 1.7 | 1.9 | .5 | .0 | 179.1 | 211.9 | 250.6 | 296.5 | 350.7 |
| Inventories, % | 146.11 | 0.34976 | 0.33589 | 0.07690128 | 0 | 20.15 | 20.15 | 20.15 | 20.15 | 20.15 |
| Accounts Payable | 92.5 | 136.5 | 95.0 | 70.7 | 58.3 | 153.7 | 181.9 | 215.1 | 254.5 | 301.0 |
| Accounts Payable, % | 23.97 | 27.99 | 16.56 | 10.21 | 7.76 | 17.3 | 17.3 | 17.3 | 17.3 | 17.3 |
| Capital Expenditure | -74.0 | -232.7 | -270.0 | -332.1 | -340.7 | -368.4 | -435.8 | -515.5 | -609.8 | -721.4 |
| Capital Expenditure, % | -19.17 | -47.7 | -47.04 | -48.01 | -45.34 | -41.45 | -41.45 | -41.45 | -41.45 | -41.45 |
| Tax Rate, % | -540.43 | -540.43 | -540.43 | -540.43 | -540.43 | -540.43 | -540.43 | -540.43 | -540.43 | -540.43 |
| EBITAT | 35.7 | 24.6 | -550.4 | 169.6 | 900.0 | -82.2 | -97.2 | -115.0 | -136.0 | -160.9 |
| Depreciation | ||||||||||
| Changes in Account Receivables | ||||||||||
| Changes in Inventories | ||||||||||
| Changes in Accounts Payable | ||||||||||
| Capital Expenditure | ||||||||||
| UFCF | -532.6 | 436.1 | -801.0 | -166.9 | 700.8 | -480.4 | -442.7 | -523.7 | -619.5 | -732.9 |
| WACC, % | 6.41 | 6.41 | 5.99 | 6.41 | 6.41 | 6.32 | 6.32 | 6.32 | 6.32 | 6.32 |
| PV UFCF | ||||||||||
| SUM PV UFCF | -2,303.4 | |||||||||
| Long Term Growth Rate, % | 2.00 | |||||||||
| Free cash flow (T + 1) | -748 | |||||||||
| Terminal Value | -17,289 | |||||||||
| Present Terminal Value | -12,724 | |||||||||
| Enterprise Value | -15,028 | |||||||||
| Net Debt | 264 | |||||||||
| Equity Value | -15,292 | |||||||||
| Diluted Shares Outstanding, MM | 53 | |||||||||
| Equity Value Per Share | -290.10 |
What You Will Get
- Real KEN Financial Data: Pre-filled with Kenon Holdings Ltd.'s historical and projected data for precise analysis.
- Fully Editable Template: Modify key inputs like revenue growth, WACC, and EBITDA % with ease.
- Automatic Calculations: See Kenon Holdings Ltd.'s intrinsic value update instantly based on your changes.
- Professional Valuation Tool: Designed for investors, analysts, and consultants seeking accurate DCF results.
- User-Friendly Design: Simple structure and clear instructions for all experience levels.
Key Features
- Comprehensive Financial Data: Access reliable pre-loaded historical figures and future forecasts for Kenon Holdings Ltd. (KEN).
- Adjustable Forecast Parameters: Modify highlighted cells for key variables like WACC, growth rates, and profit margins.
- Automated Calculations: Instant updates for DCF, Net Present Value (NPV), and cash flow assessments.
- User-Friendly Dashboard: Clear charts and summaries to help you interpret your valuation findings.
- Designed for All Levels: An intuitive layout suitable for investors, CFOs, and consultants alike.
How It Works
- 1. Download the Template: Obtain and open the Excel file containing Kenon Holdings Ltd.'s (KEN) financial data.
- 2. Adjust Key Inputs: Modify essential parameters such as revenue growth, discount rates, and capital investments.
- 3. Analyze Results in Real-Time: The DCF model automatically computes the intrinsic value and net present value (NPV).
- 4. Explore Different Scenarios: Evaluate various projections to understand potential valuation variations.
- 5. Make Informed Decisions: Deliver expert valuation analyses to enhance your strategic choices.
Why Choose Kenon Holdings Ltd. (KEN)?
- Time-Efficient: Skip the hassle of extensive research – our insights are readily available.
- Enhanced Accuracy: Dependable financial metrics and methodologies minimize valuation discrepancies.
- Completely Customizable: Adjust the parameters to suit your specific investment strategies and forecasts.
- Simple to Understand: Intuitive visuals and outputs facilitate straightforward analysis of results.
- Preferred by Professionals: Crafted for investors who prioritize accuracy and practical application.
Who Should Use This Product?
- Investors: Accurately assess Kenon Holdings Ltd.'s (KEN) fair value prior to making investment choices.
- CFOs: Utilize a professional-grade DCF model for financial reporting and analysis related to Kenon Holdings Ltd. (KEN).
- Consultants: Efficiently customize the template for valuation reports tailored to Kenon Holdings Ltd. (KEN) clients.
- Entrepreneurs: Acquire insights into financial modeling practices employed by major corporations, including Kenon Holdings Ltd. (KEN).
- Educators: Implement it as a teaching resource to illustrate valuation methodologies relevant to Kenon Holdings Ltd. (KEN).
What the Template Contains
- Historical Data: Includes Kenon Holdings Ltd.'s (KEN) past financials and baseline forecasts.
- DCF and Levered DCF Models: Detailed templates to calculate Kenon Holdings Ltd.'s (KEN) intrinsic value.
- WACC Sheet: Pre-built calculations for Weighted Average Cost of Capital.
- Editable Inputs: Modify key drivers like growth rates, EBITDA %, and CAPEX assumptions.
- Quarterly and Annual Statements: A complete breakdown of Kenon Holdings Ltd.'s (KEN) financials.
- Interactive Dashboard: Visualize valuation results and projections dynamically.
Disclaimer
All information, articles, and product details provided on this website are for general informational and educational purposes only. We do not claim any ownership over, nor do we intend to infringe upon, any trademarks, copyrights, logos, brand names, or other intellectual property mentioned or depicted on this site. Such intellectual property remains the property of its respective owners, and any references here are made solely for identification or informational purposes, without implying any affiliation, endorsement, or partnership.
We make no representations or warranties, express or implied, regarding the accuracy, completeness, or suitability of any content or products presented. Nothing on this website should be construed as legal, tax, investment, financial, medical, or other professional advice. In addition, no part of this site—including articles or product references—constitutes a solicitation, recommendation, endorsement, advertisement, or offer to buy or sell any securities, franchises, or other financial instruments, particularly in jurisdictions where such activity would be unlawful.
All content is of a general nature and may not address the specific circumstances of any individual or entity. It is not a substitute for professional advice or services. Any actions you take based on the information provided here are strictly at your own risk. You accept full responsibility for any decisions or outcomes arising from your use of this website and agree to release us from any liability in connection with your use of, or reliance upon, the content or products found herein.