
|
Valoración de DCF de los motores de aceite Kirloskar (kirloseng.ns) |
Completamente Editable: Adáptelo A Sus Necesidades En Excel O Sheets
Diseño Profesional: Plantillas Confiables Y Estándares De La Industria
Predeterminadas Para Un Uso Rápido Y Eficiente
Compatible con MAC / PC, completamente desbloqueado
No Se Necesita Experiencia; Fáciles De Seguir
Kirloskar Oil Engines Limited (KIRLOSENG.NS) Bundle
¡Descubra el verdadero potencial de Kirloskar Oil Engines Limited (Kirlosengns) con nuestra calculadora DCF avanzada! Ajuste los supuestos cruciales, explore varios escenarios y evalúe cómo los diferentes cambios influyen en la valoración de los motores de aceite Kirloskar Limited (Kirlosengns), todo dentro de una conveniente plantilla de Excel.
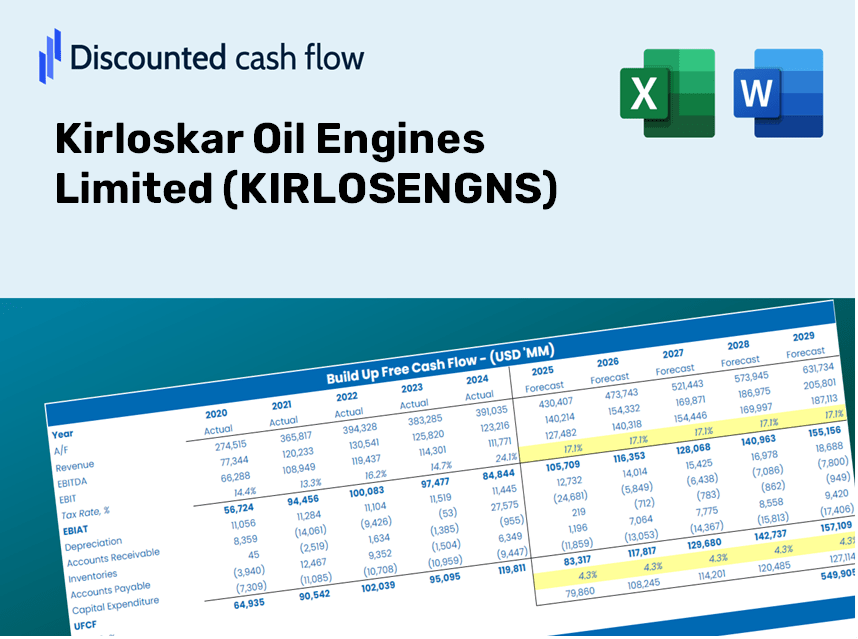
Discounted Cash Flow (DCF) - (USD MM)
| Year | AY1 2021 |
AY2 2022 |
AY3 2023 |
AY4 2024 |
AY5 2025 |
FY1 2026 |
FY2 2027 |
FY3 2028 |
FY4 2029 |
FY5 2030 |
|---|---|---|---|---|---|---|---|---|---|---|
| Revenue | 32,548.1 | 39,787.1 | 49,683.4 | 58,983.2 | 63,491.3 | 75,153.9 | 88,958.8 | 105,299.4 | 124,641.7 | 147,536.9 |
| Revenue Growth, % | 0 | 22.24 | 24.87 | 18.72 | 7.64 | 18.37 | 18.37 | 18.37 | 18.37 | 18.37 |
| EBITDA | 3,970.3 | 4,253.1 | 7,453.5 | 10,188.4 | 11,909.4 | 11,110.9 | 13,151.8 | 15,567.6 | 18,427.2 | 21,812.1 |
| EBITDA, % | 12.2 | 10.69 | 15 | 17.27 | 18.76 | 14.78 | 14.78 | 14.78 | 14.78 | 14.78 |
| Depreciation | 839.8 | 1,012.9 | 1,046.6 | 1,188.0 | 1,397.9 | 1,720.8 | 2,036.9 | 2,411.0 | 2,853.9 | 3,378.1 |
| Depreciation, % | 2.58 | 2.55 | 2.11 | 2.01 | 2.2 | 2.29 | 2.29 | 2.29 | 2.29 | 2.29 |
| EBIT | 3,130.5 | 3,240.2 | 6,406.9 | 9,000.4 | 10,511.5 | 9,390.1 | 11,114.9 | 13,156.6 | 15,573.3 | 18,434.0 |
| EBIT, % | 9.62 | 8.14 | 12.9 | 15.26 | 16.56 | 12.49 | 12.49 | 12.49 | 12.49 | 12.49 |
| Total Cash | 10,376.8 | 8,179.8 | 8,414.5 | 9,460.8 | 15,071.0 | 16,406.6 | 19,420.3 | 22,987.6 | 27,210.2 | 32,208.3 |
| Total Cash, percent | .0 | .0 | .0 | .0 | .0 | .0 | .0 | .0 | .0 | .0 |
| Account Receivables | 7,304.4 | 14,889.9 | 19,349.7 | 20,324.0 | 21,480.4 | 25,116.6 | 29,730.2 | 35,191.3 | 41,655.5 | 49,307.1 |
| Account Receivables, % | 22.44 | 37.42 | 38.95 | 34.46 | 33.83 | 33.42 | 33.42 | 33.42 | 33.42 | 33.42 |
| Inventories | 3,794.7 | 3,880.5 | 5,449.8 | 6,436.3 | 5,913.0 | 7,907.1 | 9,359.6 | 11,078.8 | 13,113.8 | 15,522.7 |
| Inventories, % | 11.66 | 9.75 | 10.97 | 10.91 | 9.31 | 10.52 | 10.52 | 10.52 | 10.52 | 10.52 |
| Accounts Payable | 5,567.5 | 5,592.3 | 6,525.0 | 7,693.5 | 7,083.1 | 10,295.1 | 12,186.2 | 14,424.7 | 17,074.3 | 20,210.7 |
| Accounts Payable, % | 17.11 | 14.06 | 13.13 | 13.04 | 11.16 | 13.7 | 13.7 | 13.7 | 13.7 | 13.7 |
| Capital Expenditure | -1,054.9 | -1,256.0 | -1,614.7 | -3,950.7 | -3,082.5 | -3,186.7 | -3,772.0 | -4,464.9 | -5,285.0 | -6,255.8 |
| Capital Expenditure, % | -3.24 | -3.16 | -3.25 | -6.7 | -4.85 | -4.24 | -4.24 | -4.24 | -4.24 | -4.24 |
| Tax Rate, % | 24.94 | 24.94 | 24.94 | 24.94 | 24.94 | 24.94 | 24.94 | 24.94 | 24.94 | 24.94 |
| EBITAT | 2,263.1 | 2,438.7 | 4,743.8 | 6,681.3 | 7,889.9 | 6,965.4 | 8,244.9 | 9,759.4 | 11,552.1 | 13,674.1 |
| Depreciation | ||||||||||
| Changes in Account Receivables | ||||||||||
| Changes in Inventories | ||||||||||
| Changes in Accounts Payable | ||||||||||
| Capital Expenditure | ||||||||||
| UFCF | -3,483.6 | -5,450.9 | -920.7 | 3,126.3 | 4,961.8 | 3,081.3 | 2,334.8 | 2,763.7 | 3,271.3 | 3,872.2 |
| WACC, % | 6.42 | 6.49 | 6.46 | 6.47 | 6.49 | 6.47 | 6.47 | 6.47 | 6.47 | 6.47 |
| PV UFCF | ||||||||||
| SUM PV UFCF | 12,620.6 | |||||||||
| Long Term Growth Rate, % | 4.00 | |||||||||
| Free cash flow (T + 1) | 4,027 | |||||||||
| Terminal Value | 163,240 | |||||||||
| Present Terminal Value | 119,331 | |||||||||
| Enterprise Value | 131,952 | |||||||||
| Net Debt | 48,220 | |||||||||
| Equity Value | 83,732 | |||||||||
| Diluted Shares Outstanding, MM | 146 | |||||||||
| Equity Value Per Share | 575.16 |
What You Will Receive
- Pre-Filled Financial Model: Utilize actual data from Kirloskar Oil Engines Limited (KIRLOSENGNS) for accurate DCF valuation.
- Comprehensive Forecast Control: Modify revenue growth, profit margins, WACC, and other essential drivers.
- Instantaneous Calculations: Automatic updates provide real-time results as you implement changes.
- Professional-Grade Template: A polished Excel file crafted for high-quality valuation presentations.
- Flexible and Reusable: Designed for adaptability, allowing for repeated application in detailed forecasting.
Key Features
- Advanced DCF Calculator: Provides comprehensive unlevered and levered DCF valuation models tailored for Kirloskar Oil Engines Limited (KIRLOSENGNS).
- WACC Calculator: Features a pre-configured Weighted Average Cost of Capital sheet with adjustable inputs specific to KIRLOSENGNS.
- Customizable Forecast Assumptions: Easily adjust growth rates, capital expenditures, and discount rates to reflect the company's strategy.
- Integrated Financial Ratios: Evaluate profitability, leverage, and efficiency ratios pertinent to Kirloskar Oil Engines Limited (KIRLOSENGNS).
- Interactive Dashboard and Charts: Visual representations provide a concise overview of essential valuation metrics for straightforward analysis.
How It Functions
- Download the Template: Gain immediate access to the Excel-based KIRLOSENGNS DCF Calculator.
- Input Your Assumptions: Modify the yellow-highlighted cells for growth rates, WACC, margins, and other variables.
- Instant Calculations: The model updates Kirloskar Oil Engines Limited’s intrinsic value in real-time.
- Test Scenarios: Explore various assumptions to assess potential changes in valuation.
- Analyze and Decide: Utilize the findings to inform your investment or financial analysis.
Why Opt for Our Calculator?
- All-in-One Solution: Features DCF, WACC, and financial ratio analyses for a comprehensive evaluation.
- Adjustable Parameters: Modify the yellow-highlighted cells to explore different scenarios.
- In-Depth Analysis: Automatically computes Kirloskar Oil Engines Limited's intrinsic value and Net Present Value.
- Preloaded Information: Access historical and projected data for reliable benchmarks.
- High-Quality Standards: Perfect for financial analysts, investors, and business advisors focusing on KIRLOSENGNS.
Who Can Benefit from This Product?
- Finance Students: Master valuation techniques and apply them using real-time data.
- Academics: Integrate professional models into your research or teaching materials.
- Investors: Evaluate your own assumptions and assess valuation outcomes for Kirloskar Oil Engines Limited (KIRLOSENGNS).
- Analysts: Enhance your efficiency with a customizable DCF model that’s ready to use.
- Small Business Owners: Understand the analytical methods used for large public companies like Kirloskar Oil Engines Limited (KIRLOSENGNS).
Contents of the Template
- Historical Data: Comprises Kirloskar Oil Engines Limited's (KIRLOSENGNS) previous financials and foundational forecasts.
- DCF and Levered DCF Models: Comprehensive templates for calculating the intrinsic value of Kirloskar Oil Engines Limited (KIRLOSENGNS).
- WACC Sheet: Pre-configured calculations for the Weighted Average Cost of Capital.
- Editable Inputs: Adjust essential drivers such as growth rates, EBITDA percentages, and CAPEX assumptions.
- Quarterly and Annual Statements: A thorough breakdown of Kirloskar Oil Engines Limited's (KIRLOSENGNS) financial data.
- Interactive Dashboard: Dynamically visualize valuation outcomes and projections.
Disclaimer
All information, articles, and product details provided on this website are for general informational and educational purposes only. We do not claim any ownership over, nor do we intend to infringe upon, any trademarks, copyrights, logos, brand names, or other intellectual property mentioned or depicted on this site. Such intellectual property remains the property of its respective owners, and any references here are made solely for identification or informational purposes, without implying any affiliation, endorsement, or partnership.
We make no representations or warranties, express or implied, regarding the accuracy, completeness, or suitability of any content or products presented. Nothing on this website should be construed as legal, tax, investment, financial, medical, or other professional advice. In addition, no part of this site—including articles or product references—constitutes a solicitation, recommendation, endorsement, advertisement, or offer to buy or sell any securities, franchises, or other financial instruments, particularly in jurisdictions where such activity would be unlawful.
All content is of a general nature and may not address the specific circumstances of any individual or entity. It is not a substitute for professional advice or services. Any actions you take based on the information provided here are strictly at your own risk. You accept full responsibility for any decisions or outcomes arising from your use of this website and agree to release us from any liability in connection with your use of, or reliance upon, the content or products found herein.