
|
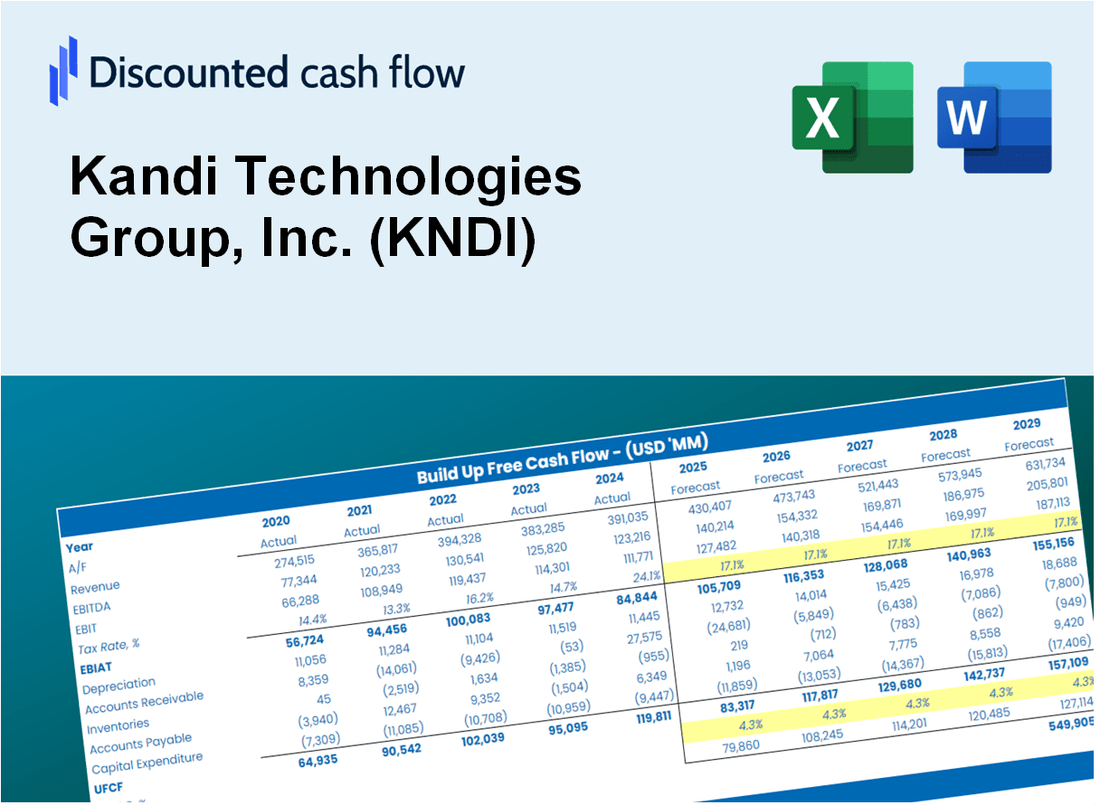
Valoración DCF de Kandi Technologies Group, Inc. (KNDI) |
Completamente Editable: Adáptelo A Sus Necesidades En Excel O Sheets
Diseño Profesional: Plantillas Confiables Y Estándares De La Industria
Predeterminadas Para Un Uso Rápido Y Eficiente
Compatible con MAC / PC, completamente desbloqueado
No Se Necesita Experiencia; Fáciles De Seguir
Kandi Technologies Group, Inc. (KNDI) Bundle
¡Mejore sus estrategias de inversión con la calculadora KNDI DCF! Explore la auténtica financiación de Kandi Technologies, ajuste las predicciones y gastos de crecimiento, y observe instantáneamente cómo estas modificaciones afectan el valor intrínseco de Kandi Technologies Group, Inc. (KNDI).
Discounted Cash Flow (DCF) - (USD MM)
| Year | AY1 2020 |
AY2 2021 |
AY3 2022 |
AY4 2023 |
AY5 2024 |
FY1 2025 |
FY2 2026 |
FY3 2027 |
FY4 2028 |
FY5 2029 |
|---|---|---|---|---|---|---|---|---|---|---|
| Revenue | 76.9 | 91.5 | 117.8 | 123.6 | 127.6 | 145.4 | 165.7 | 188.8 | 215.2 | 245.2 |
| Revenue Growth, % | 0 | 18.94 | 28.78 | 4.91 | 3.21 | 13.96 | 13.96 | 13.96 | 13.96 | 13.96 |
| EBITDA | 13.2 | 41.8 | -.4 | 16.7 | -41.9 | 12.6 | 14.3 | 16.3 | 18.6 | 21.2 |
| EBITDA, % | 17.13 | 45.74 | -0.34935 | 13.52 | -32.82 | 8.65 | 8.65 | 8.65 | 8.65 | 8.65 |
| Depreciation | 7.6 | 9.6 | 12.2 | 11.9 | 12.0 | 14.5 | 16.5 | 18.8 | 21.5 | 24.5 |
| Depreciation, % | 9.9 | 10.53 | 10.37 | 9.64 | 9.42 | 9.97 | 9.97 | 9.97 | 9.97 | 9.97 |
| EBIT | 5.6 | 32.2 | -12.6 | 4.8 | -53.9 | -1.9 | -2.2 | -2.5 | -2.9 | -3.3 |
| EBIT, % | 7.23 | 35.21 | -10.72 | 3.88 | -42.24 | -1.33 | -1.33 | -1.33 | -1.33 | -1.33 |
| Total Cash | 142.1 | 184.3 | 165.3 | 67.7 | 42.8 | 112.9 | 128.7 | 146.6 | 167.1 | 190.4 |
| Total Cash, percent | .0 | .0 | .0 | .0 | .0 | .0 | .0 | .0 | .0 | .0 |
| Account Receivables | 94.5 | 62.1 | 50.5 | 149.9 | 171.5 | 119.4 | 136.1 | 155.1 | 176.8 | 201.4 |
| Account Receivables, % | 122.8 | 67.9 | 42.86 | 121.28 | 134.46 | 82.15 | 82.15 | 82.15 | 82.15 | 82.15 |
| Inventories | 19.7 | 33.2 | 40.5 | 61.6 | 51.3 | 54.1 | 61.7 | 70.3 | 80.1 | 91.3 |
| Inventories, % | 25.61 | 36.26 | 34.36 | 49.8 | 40.19 | 37.24 | 37.24 | 37.24 | 37.24 | 37.24 |
| Accounts Payable | 34.3 | 36.7 | 35.3 | 28.7 | 25.5 | 45.9 | 52.3 | 59.6 | 67.9 | 77.4 |
| Accounts Payable, % | 44.54 | 40.09 | 29.98 | 23.26 | 19.97 | 31.57 | 31.57 | 31.57 | 31.57 | 31.57 |
| Capital Expenditure | -18.2 | -19.1 | -3.8 | -13.2 | -.9 | -17.2 | -19.6 | -22.4 | -25.5 | -29.1 |
| Capital Expenditure, % | -23.64 | -20.92 | -3.24 | -10.72 | -0.73293 | -11.85 | -11.85 | -11.85 | -11.85 | -11.85 |
| Tax Rate, % | 9.96 | 9.96 | 9.96 | 9.96 | 9.96 | 9.96 | 9.96 | 9.96 | 9.96 | 9.96 |
| EBITAT | 3.7 | 25.2 | -11.5 | .0 | -48.5 | -1.3 | -1.4 | -1.6 | -1.9 | -2.1 |
| Depreciation | ||||||||||
| Changes in Account Receivables | ||||||||||
| Changes in Inventories | ||||||||||
| Changes in Accounts Payable | ||||||||||
| Capital Expenditure | ||||||||||
| UFCF | -86.7 | 37.0 | -.1 | -128.4 | -52.0 | 65.7 | -22.4 | -25.5 | -29.1 | -33.1 |
| WACC, % | 3.99 | 4.19 | 4.42 | 2.76 | 4.4 | 3.95 | 3.95 | 3.95 | 3.95 | 3.95 |
| PV UFCF | ||||||||||
| SUM PV UFCF | -32.4 | |||||||||
| Long Term Growth Rate, % | 2.00 | |||||||||
| Free cash flow (T + 1) | -34 | |||||||||
| Terminal Value | -1,729 | |||||||||
| Present Terminal Value | -1,425 | |||||||||
| Enterprise Value | -1,457 | |||||||||
| Net Debt | 48 | |||||||||
| Equity Value | -1,505 | |||||||||
| Diluted Shares Outstanding, MM | 86 | |||||||||
| Equity Value Per Share | -17.48 |
What You Will Get
- Real KNDI Financial Data: Pre-filled with Kandi Technologies Group’s historical and projected data for precise analysis.
- Fully Editable Template: Modify key inputs like revenue growth, WACC, and EBITDA % with ease.
- Automatic Calculations: See Kandi Technologies’ intrinsic value update instantly based on your changes.
- Professional Valuation Tool: Designed for investors, analysts, and consultants seeking accurate DCF results.
- User-Friendly Design: Simple structure and clear instructions for all experience levels.
Key Features
- Comprehensive DCF Calculator: Features detailed unlevered and levered DCF valuation models tailored for Kandi Technologies Group, Inc. (KNDI).
- WACC Calculator: Pre-configured Weighted Average Cost of Capital sheet with adjustable inputs specific to KNDI.
- Customizable Forecast Assumptions: Easily alter growth rates, capital expenditures, and discount rates to fit KNDI's financial outlook.
- Integrated Financial Ratios: Evaluate profitability, leverage, and efficiency ratios relevant to Kandi Technologies Group, Inc. (KNDI).
- Interactive Dashboard and Charts: Visual representations summarize essential valuation metrics for straightforward analysis of KNDI.
How It Works
- 1. Access the Template: Download and open the Excel file containing Kandi Technologies Group, Inc.'s (KNDI) preloaded data.
- 2. Modify Assumptions: Adjust key inputs such as growth rates, WACC, and capital expenditures.
- 3. View Results Instantly: The DCF model automatically calculates intrinsic value and NPV.
- 4. Explore Scenarios: Analyze different valuation outcomes by comparing multiple forecasts.
- 5. Present with Confidence: Share professional valuation insights to back your decisions.
Why Choose This Calculator for Kandi Technologies Group, Inc. (KNDI)?
- User-Friendly Interface: Tailored for both novices and seasoned analysts.
- Customizable Parameters: Adjust inputs effortlessly to align with your financial assessment.
- Real-Time Feedback: Observe immediate updates to Kandi’s valuation as you tweak inputs.
- Preloaded Data: Comes equipped with Kandi’s latest financial metrics for swift evaluations.
- Relied Upon by Experts: Favored by investors and analysts for making well-informed choices.
Who Should Use Kandi Technologies Group, Inc. (KNDI)?
- Investors: Make informed investment choices with reliable insights into KNDI's market performance.
- Financial Analysts: Streamline your analysis with comprehensive financial models tailored for KNDI.
- Consultants: Effortlessly modify reports and presentations focused on KNDI for your clients.
- Finance Enthusiasts: Enhance your knowledge of the electric vehicle sector through KNDI's case studies.
- Educators and Students: Utilize KNDI's data as a practical resource for finance and business education.
What the Template Contains
- Pre-Filled DCF Model: Kandi Technologies Group, Inc.'s (KNDI) financial data preloaded for immediate use.
- WACC Calculator: Detailed calculations for Weighted Average Cost of Capital.
- Financial Ratios: Evaluate Kandi's profitability, leverage, and efficiency.
- Editable Inputs: Change assumptions such as growth, margins, and CAPEX to fit your scenarios.
- Financial Statements: Annual and quarterly reports to support detailed analysis.
- Interactive Dashboard: Easily visualize key valuation metrics and results.
Disclaimer
All information, articles, and product details provided on this website are for general informational and educational purposes only. We do not claim any ownership over, nor do we intend to infringe upon, any trademarks, copyrights, logos, brand names, or other intellectual property mentioned or depicted on this site. Such intellectual property remains the property of its respective owners, and any references here are made solely for identification or informational purposes, without implying any affiliation, endorsement, or partnership.
We make no representations or warranties, express or implied, regarding the accuracy, completeness, or suitability of any content or products presented. Nothing on this website should be construed as legal, tax, investment, financial, medical, or other professional advice. In addition, no part of this site—including articles or product references—constitutes a solicitation, recommendation, endorsement, advertisement, or offer to buy or sell any securities, franchises, or other financial instruments, particularly in jurisdictions where such activity would be unlawful.
All content is of a general nature and may not address the specific circumstances of any individual or entity. It is not a substitute for professional advice or services. Any actions you take based on the information provided here are strictly at your own risk. You accept full responsibility for any decisions or outcomes arising from your use of this website and agree to release us from any liability in connection with your use of, or reliance upon, the content or products found herein.