
|
KPIT Technologies Limited (kpittech.ns) Valoración de DCF |
Completamente Editable: Adáptelo A Sus Necesidades En Excel O Sheets
Diseño Profesional: Plantillas Confiables Y Estándares De La Industria
Predeterminadas Para Un Uso Rápido Y Eficiente
Compatible con MAC / PC, completamente desbloqueado
No Se Necesita Experiencia; Fáciles De Seguir
KPIT Technologies Limited (KPITTECH.NS) Bundle
¡Evalúe la perspectiva financiera de KPIT Technologies Limited como un experto! Esta calculadora DCF (KPITECHNS) proporciona datos financieros previamente rellenos y ofrece una flexibilidad completa para modificar el crecimiento de los ingresos, WACC, los márgenes y otros supuestos esenciales para alinearse con sus proyecciones.
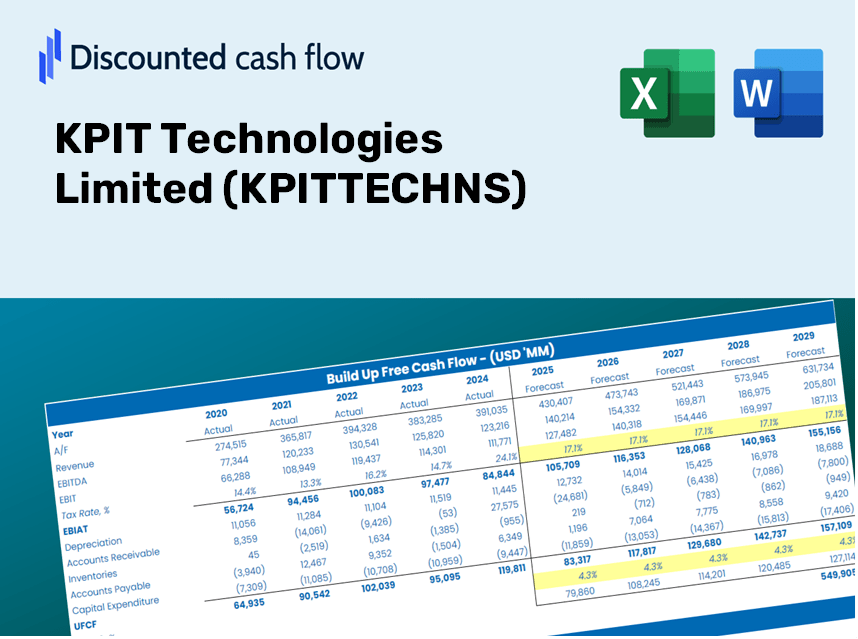
Discounted Cash Flow (DCF) - (USD MM)
| Year | AY1 2021 |
AY2 2022 |
AY3 2023 |
AY4 2024 |
AY5 2025 |
FY1 2026 |
FY2 2027 |
FY3 2028 |
FY4 2029 |
FY5 2030 |
|---|---|---|---|---|---|---|---|---|---|---|
| Revenue | 20,357.4 | 24,323.9 | 33,650.4 | 20,166.0 | 58,423.5 | 75,622.6 | 97,885.0 | 126,701.2 | 164,000.5 | 212,280.3 |
| Revenue Growth, % | 0 | 19.48 | 38.34 | -40.07 | 189.71 | 29.44 | 29.44 | 29.44 | 29.44 | 29.44 |
| EBITDA | 3,280.5 | 4,833.6 | 4,835.5 | 10,513.7 | 13,971.0 | 19,118.2 | 24,746.4 | 32,031.4 | 41,461.0 | 53,666.7 |
| EBITDA, % | 16.11 | 19.87 | 14.37 | 52.14 | 23.91 | 25.28 | 25.28 | 25.28 | 25.28 | 25.28 |
| Depreciation | 1,331.7 | 1,196.1 | 1,196.1 | 1,957.9 | 2,249.6 | 4,321.6 | 5,593.8 | 7,240.6 | 9,372.1 | 12,131.2 |
| Depreciation, % | 6.54 | 4.92 | 3.55 | 9.71 | 3.85 | 5.71 | 5.71 | 5.71 | 5.71 | 5.71 |
| EBIT | 1,948.8 | 3,637.4 | 3,639.4 | 8,555.8 | 11,721.4 | 14,796.6 | 19,152.5 | 24,790.8 | 32,088.9 | 41,535.5 |
| EBIT, % | 9.57 | 14.95 | 10.82 | 42.43 | 20.06 | 19.57 | 19.57 | 19.57 | 19.57 | 19.57 |
| Total Cash | 8,269.6 | 10,001.7 | 10,001.7 | 8,558.9 | 15,661.7 | 27,331.9 | 35,378.0 | 45,792.9 | 59,273.8 | 76,723.3 |
| Total Cash, percent | .0 | .0 | .0 | .0 | .0 | .0 | .0 | .0 | .0 | .0 |
| Account Receivables | 4,343.0 | 4,343.0 | 4,782.4 | 9,562.7 | 8,898.5 | 17,552.3 | 22,719.5 | 29,407.8 | 38,065.1 | 49,271.1 |
| Account Receivables, % | 21.33 | 17.85 | 14.21 | 47.42 | 15.23 | 23.21 | 23.21 | 23.21 | 23.21 | 23.21 |
| Inventories | -1,261.6 | -1,075.7 | 587.5 | 902.5 | 846.9 | -446.0 | -577.3 | -747.2 | -967.2 | -1,251.9 |
| Inventories, % | -6.2 | -4.42 | 1.75 | 4.48 | 1.45 | -0.58976 | -0.58976 | -0.58976 | -0.58976 | -0.58976 |
| Accounts Payable | 1,352.4 | 1,372.3 | 1,372.3 | 2,397.7 | 1,782.3 | 4,734.5 | 6,128.3 | 7,932.4 | 10,267.7 | 13,290.3 |
| Accounts Payable, % | 6.64 | 5.64 | 4.08 | 11.89 | 3.05 | 6.26 | 6.26 | 6.26 | 6.26 | 6.26 |
| Capital Expenditure | -599.8 | -599.8 | -1,295.0 | -1,553.4 | -1,295.3 | -2,900.9 | -3,754.9 | -4,860.3 | -6,291.1 | -8,143.1 |
| Capital Expenditure, % | -2.95 | -2.47 | -3.85 | -7.7 | -2.22 | -3.84 | -3.84 | -3.84 | -3.84 | -3.84 |
| Tax Rate, % | 25.87 | 25.87 | 25.87 | 25.87 | 25.87 | 25.87 | 25.87 | 25.87 | 25.87 | 25.87 |
| EBITAT | 1,603.3 | 2,895.1 | 2,791.1 | 6,354.9 | 8,689.5 | 11,451.6 | 14,822.9 | 19,186.5 | 24,834.8 | 32,145.9 |
| Depreciation | ||||||||||
| Changes in Account Receivables | ||||||||||
| Changes in Inventories | ||||||||||
| Changes in Accounts Payable | ||||||||||
| Capital Expenditure | ||||||||||
| UFCF | 606.3 | 3,325.5 | 589.7 | 2,689.6 | 9,748.3 | 8,463.6 | 13,019.7 | 16,852.5 | 21,813.7 | 28,235.4 |
| WACC, % | 4.72 | 4.72 | 4.72 | 4.71 | 4.71 | 4.72 | 4.72 | 4.72 | 4.72 | 4.72 |
| PV UFCF | ||||||||||
| SUM PV UFCF | 75,198.3 | |||||||||
| Long Term Growth Rate, % | 4.00 | |||||||||
| Free cash flow (T + 1) | 29,365 | |||||||||
| Terminal Value | 4,099,535 | |||||||||
| Present Terminal Value | 3,255,841 | |||||||||
| Enterprise Value | 3,331,040 | |||||||||
| Net Debt | -7,294 | |||||||||
| Equity Value | 3,338,334 | |||||||||
| Diluted Shares Outstanding, MM | 273 | |||||||||
| Equity Value Per Share | 12,206.64 |
Benefits of Choosing KPIT Technologies Limited (KPITTECHNS)
- Comprehensive Financial Model: Leverage KPIT's actual performance data for accurate DCF valuation.
- Complete Forecasting Control: Adjust critical factors such as revenue growth, profit margins, WACC, and other essential drivers.
- Real-Time Calculations: Enjoy automatic updates that reflect your changes instantly.
- Professional-Grade Template: An elegantly crafted Excel file tailored for high-quality valuation reporting.
- Flexible and Reusable: Designed for adaptability, facilitating repeated usage for in-depth financial forecasts.
Key Features
- 🔍 Real-Life KPIT Technologies Financials: Pre-populated historical and forecasted data for KPIT Technologies Limited (KPITTECHNS).
- ✏️ Fully Customizable Inputs: Modify all essential parameters (yellow cells) such as WACC, growth %, and tax rates.
- 📊 Professional DCF Valuation: Integrated formulas evaluate KPIT’s intrinsic value using the Discounted Cash Flow approach.
- ⚡ Instant Results: See KPIT's valuation immediately after making adjustments.
- Scenario Analysis: Analyze and compare results for different financial scenarios side-by-side.
How It Operates
- Step 1: Download the Excel file.
- Step 2: Examine the pre-populated KPIT Technologies data (historical and projected).
- Step 3: Modify key assumptions (highlighted in yellow) based on your analysis.
- Step 4: Observe automatic recalculations for KPIT Technologies' intrinsic value.
- Step 5: Utilize the results for investment decisions or reporting.
Why Choose the KPIT Technologies Limited (KPITTECHNS) Calculator?
- Precision: Leverage KPIT’s real financial data for unmatched accuracy.
- Versatility: Tailored for users to easily customize and test various inputs.
- Efficiency: Eliminate the complexity of creating a financial model from the ground up.
- Expert-Grade: Crafted with the precision and functionality expected by industry professionals.
- Intuitive: Designed for effortless use, even for those new to financial modeling.
Who Should Consider Using KPIT Technologies Limited (KPITTECHNS)?
- Individual Investors: Make well-informed choices regarding the purchase or sale of KPIT Technologies Limited (KPITTECHNS) shares.
- Financial Analysts: Enhance valuation methods with convenient access to comprehensive financial models.
- Consultants: Provide timely and precise valuation insights to your clients in relation to KPIT Technologies Limited (KPITTECHNS).
- Business Owners: Gain insights into how technology firms like KPIT Technologies Limited (KPITTECHNS) are valued to inform your own business strategies.
- Finance Students: Explore valuation techniques using real-world data and scenarios specific to KPIT Technologies Limited (KPITTECHNS).
Contents of the Template
- Historical Data: Comprises KPIT Technologies Limited's (KPITTECHNS) previous financials and foundational forecasts.
- DCF and Levered DCF Models: Comprehensive templates to assess the intrinsic value of KPIT Technologies Limited (KPITTECHNS).
- WACC Sheet: Ready-made calculations for the Weighted Average Cost of Capital.
- Editable Inputs: Adjust critical drivers such as growth rates, EBITDA %, and CAPEX expectations.
- Quarterly and Annual Statements: An extensive overview of KPIT Technologies Limited's (KPITTECHNS) financial performance.
- Interactive Dashboard: Dynamically visualize valuation results and forecasts.
Disclaimer
All information, articles, and product details provided on this website are for general informational and educational purposes only. We do not claim any ownership over, nor do we intend to infringe upon, any trademarks, copyrights, logos, brand names, or other intellectual property mentioned or depicted on this site. Such intellectual property remains the property of its respective owners, and any references here are made solely for identification or informational purposes, without implying any affiliation, endorsement, or partnership.
We make no representations or warranties, express or implied, regarding the accuracy, completeness, or suitability of any content or products presented. Nothing on this website should be construed as legal, tax, investment, financial, medical, or other professional advice. In addition, no part of this site—including articles or product references—constitutes a solicitation, recommendation, endorsement, advertisement, or offer to buy or sell any securities, franchises, or other financial instruments, particularly in jurisdictions where such activity would be unlawful.
All content is of a general nature and may not address the specific circumstances of any individual or entity. It is not a substitute for professional advice or services. Any actions you take based on the information provided here are strictly at your own risk. You accept full responsibility for any decisions or outcomes arising from your use of this website and agree to release us from any liability in connection with your use of, or reliance upon, the content or products found herein.