
|
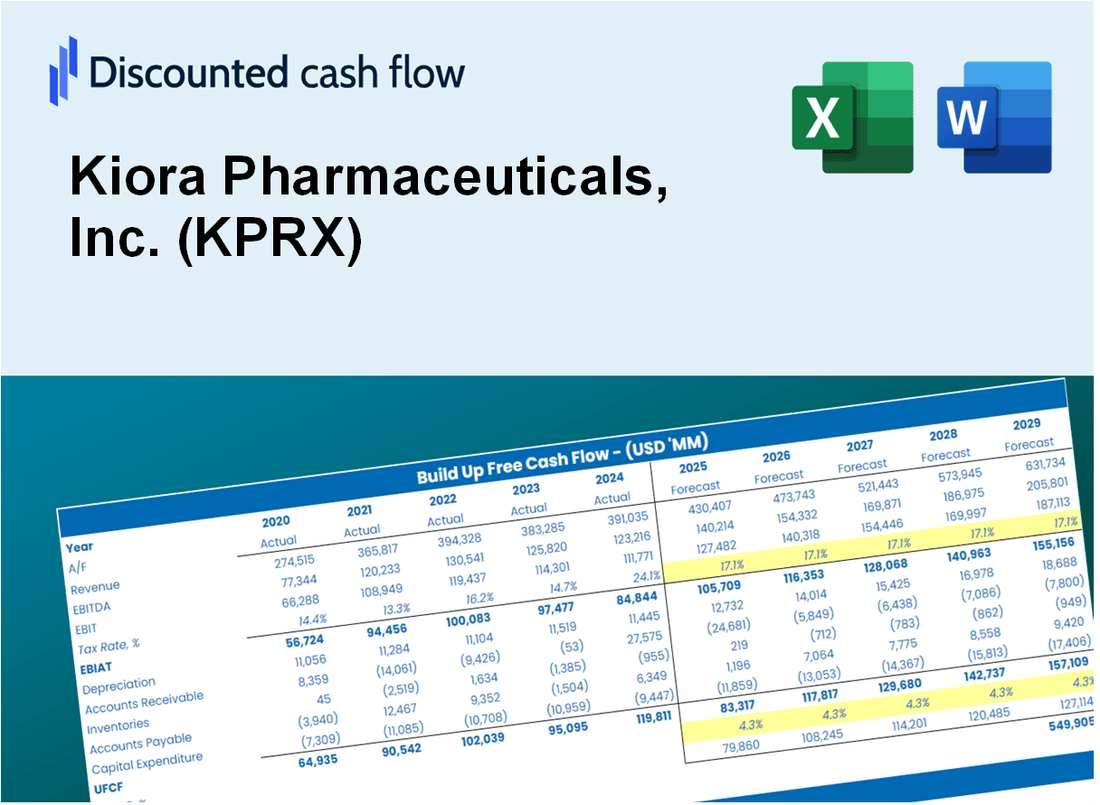
Valoración DCF de Kiora Pharmaceuticals, Inc. (KPRX) |
Completamente Editable: Adáptelo A Sus Necesidades En Excel O Sheets
Diseño Profesional: Plantillas Confiables Y Estándares De La Industria
Predeterminadas Para Un Uso Rápido Y Eficiente
Compatible con MAC / PC, completamente desbloqueado
No Se Necesita Experiencia; Fáciles De Seguir
Kiora Pharmaceuticals, Inc. (KPRX) Bundle
¡Optimice su tiempo y mejore la precisión con nuestra calculadora DCF (KPRX)! Utilizando datos reales de Kiora Pharmaceuticals, Inc. y suposiciones personalizables, esta herramienta le permite pronosticar, analizar y valorar Kiora Pharmaceuticals como un inversor experimentado.
What You Will Get
- Real Kiora Data: Preloaded financials – from revenue to EBIT – based on actual and projected figures for Kiora Pharmaceuticals, Inc. (KPRX).
- Full Customization: Adjust all critical parameters (yellow cells) like WACC, growth %, and tax rates specific to KPRX.
- Instant Valuation Updates: Automatic recalculations to analyze the impact of changes on Kiora’s fair value.
- Versatile Excel Template: Tailored for quick edits, scenario testing, and detailed projections for KPRX.
- Time-Saving and Accurate: Skip building models from scratch while maintaining precision and flexibility for Kiora Pharmaceuticals, Inc. (KPRX).
Key Features
- Customizable Research Inputs: Adjust essential metrics such as drug development timelines, market penetration rates, and R&D expenditures.
- Instant Valuation Metrics: Computes intrinsic value, net present value (NPV), and other essential outputs in real-time.
- High-Precision Analytics: Leverages Kiora Pharmaceuticals' actual financial data for accurate valuation results.
- Streamlined Scenario Testing: Effortlessly evaluate various hypotheses and assess their impacts.
- Efficiency Booster: Remove the hassle of constructing intricate valuation models from the ground up.
How It Works
- 1. Open the Template: Download and open the Excel file containing Kiora Pharmaceuticals, Inc.'s preloaded data.
- 2. Edit Assumptions: Modify key inputs such as growth rates, WACC, and capital expenditures specific to KPRX.
- 3. View Results Instantly: The DCF model automatically calculates intrinsic value and NPV for Kiora Pharmaceuticals.
- 4. Test Scenarios: Evaluate various forecasts to explore different valuation outcomes for KPRX.
- 5. Use with Confidence: Present professional valuation insights related to Kiora Pharmaceuticals, Inc. to inform your decisions.
Why Choose This Calculator?
- Designed for Industry Leaders: A sophisticated tool utilized by pharmaceutical analysts, investment managers, and healthcare consultants.
- Comprehensive Data: Kiora Pharmaceuticals’ historical and projected financials preloaded for enhanced precision.
- Flexible Scenario Analysis: Effortlessly simulate various forecasts and assumptions to evaluate potential outcomes.
- Insightful Results: Automatically computes intrinsic value, NPV, and essential financial metrics.
- User-Friendly Interface: Step-by-step guidance ensures a seamless experience throughout the calculation process.
Who Should Use This Product?
- Investors: Accurately estimate Kiora Pharmaceuticals’ fair value before making investment decisions.
- CFOs: Leverage a professional-grade DCF model for financial reporting and analysis related to Kiora Pharmaceuticals (KPRX).
- Consultants: Quickly adapt the template for valuation reports for clients focusing on Kiora Pharmaceuticals (KPRX).
- Entrepreneurs: Gain insights into financial modeling used by leading pharmaceutical companies, including Kiora Pharmaceuticals (KPRX).
- Educators: Use it as a teaching tool to demonstrate valuation methodologies relevant to the pharmaceutical industry.
What the Template Contains
- Pre-Filled DCF Model: Kiora Pharmaceuticals’ financial data preloaded for immediate use.
- WACC Calculator: Detailed calculations for Weighted Average Cost of Capital.
- Financial Ratios: Evaluate Kiora Pharmaceuticals’ profitability, leverage, and efficiency.
- Editable Inputs: Change assumptions such as growth, margins, and CAPEX to fit your scenarios.
- Financial Statements: Annual and quarterly reports to support detailed analysis.
- Interactive Dashboard: Easily visualize key valuation metrics and results.
Disclaimer
All information, articles, and product details provided on this website are for general informational and educational purposes only. We do not claim any ownership over, nor do we intend to infringe upon, any trademarks, copyrights, logos, brand names, or other intellectual property mentioned or depicted on this site. Such intellectual property remains the property of its respective owners, and any references here are made solely for identification or informational purposes, without implying any affiliation, endorsement, or partnership.
We make no representations or warranties, express or implied, regarding the accuracy, completeness, or suitability of any content or products presented. Nothing on this website should be construed as legal, tax, investment, financial, medical, or other professional advice. In addition, no part of this site—including articles or product references—constitutes a solicitation, recommendation, endorsement, advertisement, or offer to buy or sell any securities, franchises, or other financial instruments, particularly in jurisdictions where such activity would be unlawful.
All content is of a general nature and may not address the specific circumstances of any individual or entity. It is not a substitute for professional advice or services. Any actions you take based on the information provided here are strictly at your own risk. You accept full responsibility for any decisions or outcomes arising from your use of this website and agree to release us from any liability in connection with your use of, or reliance upon, the content or products found herein.