|
Valoración DCF de Kronos Worldwide, Inc. (KRO) |
Completamente Editable: Adáptelo A Sus Necesidades En Excel O Sheets
Diseño Profesional: Plantillas Confiables Y Estándares De La Industria
Predeterminadas Para Un Uso Rápido Y Eficiente
Compatible con MAC / PC, completamente desbloqueado
No Se Necesita Experiencia; Fáciles De Seguir
Kronos Worldwide, Inc. (KRO) Bundle
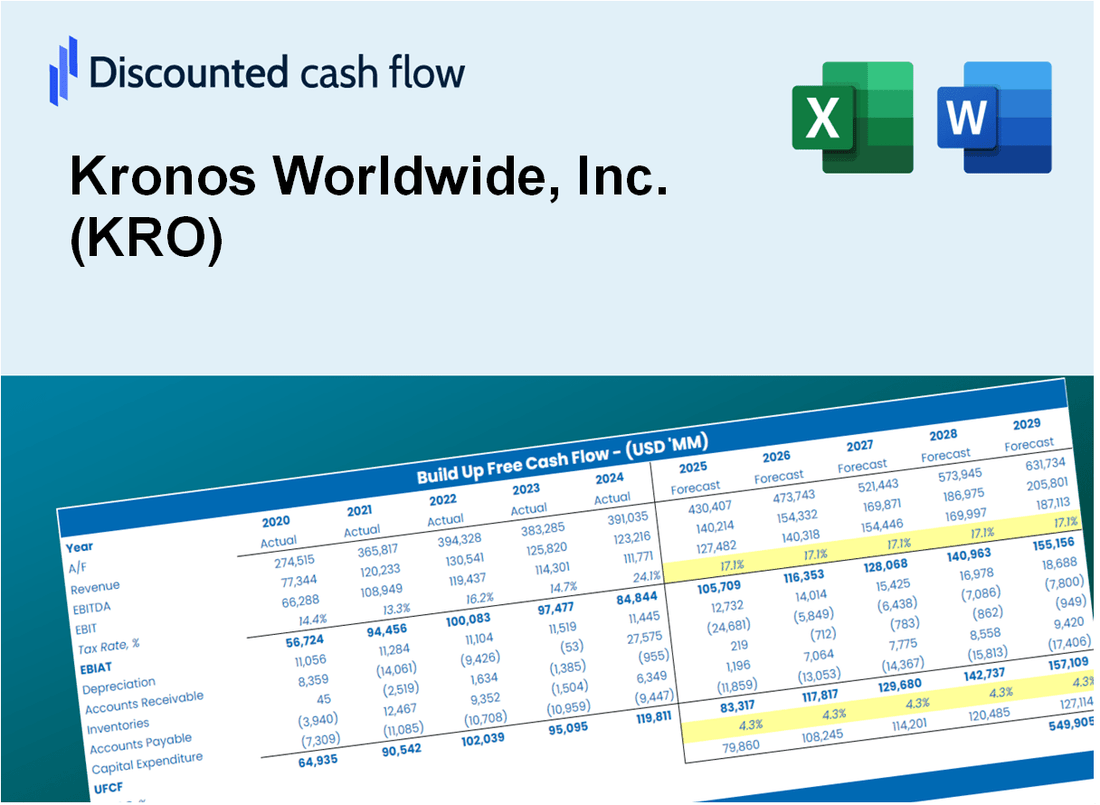
¡Agilice su análisis y mejore la precisión con nuestra calculadora DCF [KRO]! Equipado con datos reales de Kronos Worldwide, Inc. y suposiciones personalizables, esta herramienta le permite pronosticar, analizar y evaluar [compañía] como un inversor experimentado.
What You Will Get
- Real KRO Financial Data: Pre-filled with Kronos Worldwide’s historical and projected data for precise analysis.
- Fully Editable Template: Modify key inputs like revenue growth, WACC, and EBITDA % with ease.
- Automatic Calculations: See Kronos Worldwide’s intrinsic value update instantly based on your changes.
- Professional Valuation Tool: Designed for investors, analysts, and consultants seeking accurate DCF results.
- User-Friendly Design: Simple structure and clear instructions for all experience levels.
Key Features
- Comprehensive DCF Calculator: Features detailed unlevered and levered DCF valuation models tailored for Kronos Worldwide, Inc. (KRO).
- WACC Calculator: Pre-designed Weighted Average Cost of Capital sheet with adjustable inputs specific to KRO.
- Customizable Forecast Assumptions: Adjust growth rates, capital expenditures, and discount rates to fit KRO's financial outlook.
- Integrated Financial Ratios: Evaluate profitability, leverage, and efficiency ratios pertinent to Kronos Worldwide, Inc. (KRO).
- Visual Dashboard and Charts: Graphical representations summarize essential valuation metrics for straightforward analysis of KRO.
How It Works
- Step 1: Download the prebuilt Excel template containing Kronos Worldwide, Inc. (KRO) data.
- Step 2: Navigate through the pre-filled sheets to familiarize yourself with the essential metrics.
- Step 3: Modify forecasts and assumptions in the editable yellow cells (WACC, growth rates, profit margins).
- Step 4: Instantly see the updated results, including the intrinsic value of Kronos Worldwide, Inc. (KRO).
- Step 5: Use the outputs to make well-informed investment choices or to create detailed reports.
Why Choose Kronos Worldwide, Inc. (KRO)?
- Save Time: Utilize our pre-built models without the hassle of starting from scratch.
- Enhance Accuracy: Access dependable financial metrics and formulas to minimize valuation errors.
- Completely Customizable: Adjust the model to align with your specific assumptions and forecasts.
- Simple to Understand: Intuitive charts and outputs facilitate easy analysis of results.
- Endorsed by Professionals: Crafted for experts who prioritize both accuracy and functionality.
Who Should Use Kronos Worldwide, Inc. (KRO)?
- Investors: Make informed investment choices with comprehensive insights into titanium dioxide markets.
- Financial Analysts: Enhance your analysis with tailored reports on KRO's financial performance and market trends.
- Consultants: Utilize KRO's data for impactful presentations and strategic recommendations for clients.
- Industry Professionals: Gain a deeper understanding of the chemical manufacturing sector through KRO's operational insights.
- Students and Educators: Explore real-world applications of chemical industry concepts in academic settings.
What the Template Contains
- Preloaded KRO Data: Historical and projected financial data, including revenue, EBIT, and capital expenditures.
- DCF and WACC Models: Professional-grade sheets for calculating intrinsic value and Weighted Average Cost of Capital.
- Editable Inputs: Yellow-highlighted cells for adjusting revenue growth, tax rates, and discount rates.
- Financial Statements: Comprehensive annual and quarterly financials for deeper analysis.
- Key Ratios: Profitability, leverage, and efficiency ratios to evaluate performance.
- Dashboard and Charts: Visual summaries of valuation outcomes and assumptions.
Disclaimer
All information, articles, and product details provided on this website are for general informational and educational purposes only. We do not claim any ownership over, nor do we intend to infringe upon, any trademarks, copyrights, logos, brand names, or other intellectual property mentioned or depicted on this site. Such intellectual property remains the property of its respective owners, and any references here are made solely for identification or informational purposes, without implying any affiliation, endorsement, or partnership.
We make no representations or warranties, express or implied, regarding the accuracy, completeness, or suitability of any content or products presented. Nothing on this website should be construed as legal, tax, investment, financial, medical, or other professional advice. In addition, no part of this site—including articles or product references—constitutes a solicitation, recommendation, endorsement, advertisement, or offer to buy or sell any securities, franchises, or other financial instruments, particularly in jurisdictions where such activity would be unlawful.
All content is of a general nature and may not address the specific circumstances of any individual or entity. It is not a substitute for professional advice or services. Any actions you take based on the information provided here are strictly at your own risk. You accept full responsibility for any decisions or outcomes arising from your use of this website and agree to release us from any liability in connection with your use of, or reliance upon, the content or products found herein.