
|
Valoración DCF de Kura Sushi USA, Inc. (KRUS) |
Completamente Editable: Adáptelo A Sus Necesidades En Excel O Sheets
Diseño Profesional: Plantillas Confiables Y Estándares De La Industria
Predeterminadas Para Un Uso Rápido Y Eficiente
Compatible con MAC / PC, completamente desbloqueado
No Se Necesita Experiencia; Fáciles De Seguir
Kura Sushi USA, Inc. (KRUS) Bundle
Ingementista para su precisión, nuestra calculadora DCF (KRUS) le permite evaluar la valoración de Kura Sushi USA, Inc. utilizando datos financieros del mundo real y ofrece una flexibilidad completa para modificar todos los parámetros esenciales para las proyecciones mejoradas.
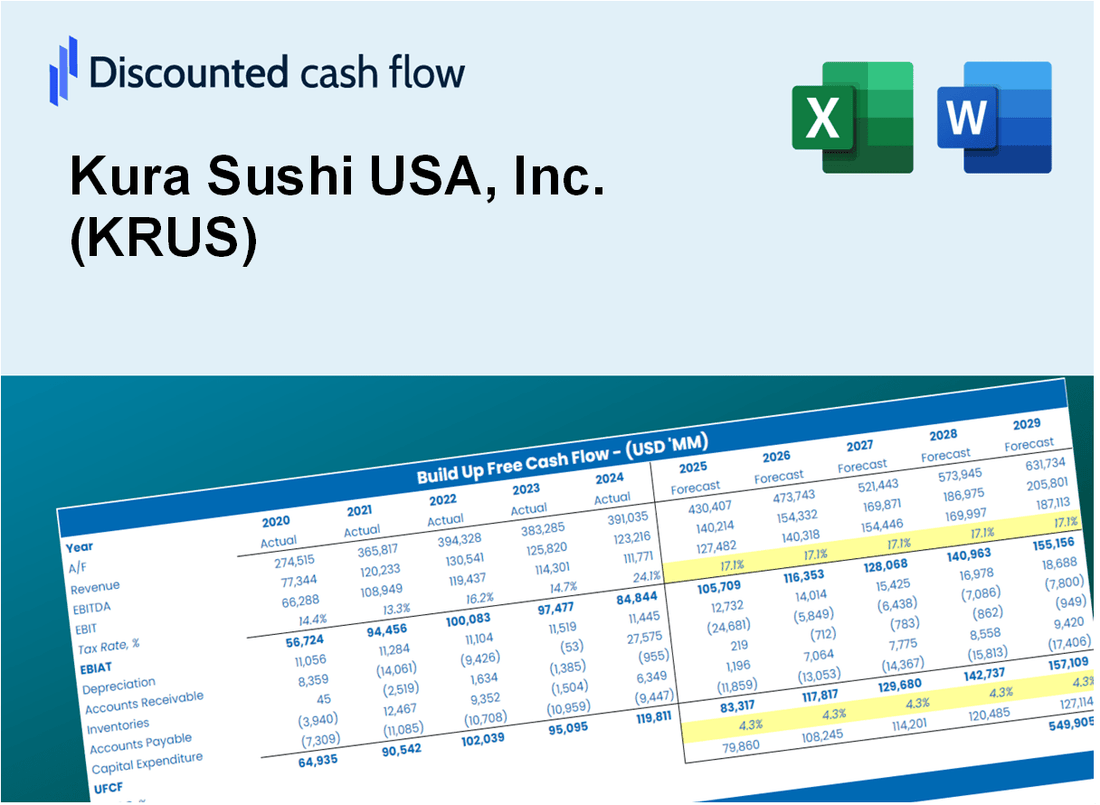
Discounted Cash Flow (DCF) - (USD MM)
| Year | AY1 2021 |
AY2 2022 |
AY3 2023 |
AY4 2024 |
AY5 2025 |
FY1 2026 |
FY2 2027 |
FY3 2028 |
FY4 2029 |
FY5 2030 |
|---|---|---|---|---|---|---|---|---|---|---|
| Revenue | 64.9 | 141.1 | 187.4 | 237.9 | 282.8 | 409.0 | 591.7 | 855.9 | 1,238.2 | 1,791.1 |
| Revenue Growth, % | 0 | 117.42 | 32.84 | 26.91 | 18.88 | 44.66 | 44.66 | 44.66 | 44.66 | 44.66 |
| EBITDA | -5.8 | 5.0 | 9.6 | 3.2 | 11.9 | 4.3 | 6.2 | 9.0 | 13.0 | 18.8 |
| EBITDA, % | -9 | 3.55 | 5.14 | 1.34 | 4.22 | 1.05 | 1.05 | 1.05 | 1.05 | 1.05 |
| Depreciation | 7.2 | 8.8 | 7.8 | 11.8 | 13.6 | 25.6 | 37.0 | 53.5 | 77.4 | 112.0 |
| Depreciation, % | 11.07 | 6.24 | 4.18 | 4.96 | 4.81 | 6.25 | 6.25 | 6.25 | 6.25 | 6.25 |
| EBIT | -13.0 | -3.8 | 1.8 | -8.6 | -1.7 | -21.3 | -30.8 | -44.5 | -64.4 | -93.1 |
| EBIT, % | -20.08 | -2.69 | 0.9625 | -3.61 | -0.58671 | -5.2 | -5.2 | -5.2 | -5.2 | -5.2 |
| Total Cash | 40.4 | 35.8 | 78.2 | 51.0 | 62.5 | 141.5 | 204.7 | 296.0 | 428.2 | 619.5 |
| Total Cash, percent | .0 | .0 | .0 | .0 | .0 | .0 | .0 | .0 | .0 | .0 |
| Account Receivables | 2.3 | 2.6 | 5.2 | 4.7 | 6.4 | 10.2 | 14.8 | 21.4 | 31.0 | 44.8 |
| Account Receivables, % | 3.62 | 1.87 | 2.75 | 1.99 | 2.27 | 2.5 | 2.5 | 2.5 | 2.5 | 2.5 |
| Inventories | .7 | 1.1 | 1.7 | 2.2 | 2.1 | 3.7 | 5.4 | 7.8 | 11.3 | 16.3 |
| Inventories, % | 1.13 | 0.79383 | 0.93209 | 0.9329 | 0.75717 | 0.90911 | 0.90911 | 0.90911 | 0.90911 | 0.90911 |
| Accounts Payable | 4.9 | 5.6 | 7.2 | 9.0 | 11.5 | 19.0 | 27.5 | 39.8 | 57.6 | 83.3 |
| Accounts Payable, % | 7.58 | 3.94 | 3.87 | 3.77 | 4.08 | 4.65 | 4.65 | 4.65 | 4.65 | 4.65 |
| Capital Expenditure | .0 | -27.7 | -40.8 | -44.5 | 3.2 | -49.2 | -71.1 | -102.9 | -148.9 | -215.4 |
| Capital Expenditure, % | -0.02193216 | -19.61 | -21.77 | -18.72 | 1.12 | -12.02 | -12.02 | -12.02 | -12.02 | -12.02 |
| Tax Rate, % | -10.12 | -10.12 | -10.12 | -10.12 | -10.12 | -10.12 | -10.12 | -10.12 | -10.12 | -10.12 |
| EBITAT | -13.2 | -4.2 | 1.6 | -8.8 | -1.8 | -20.7 | -29.9 | -43.3 | -62.7 | -90.6 |
| Depreciation | ||||||||||
| Changes in Account Receivables | ||||||||||
| Changes in Inventories | ||||||||||
| Changes in Accounts Payable | ||||||||||
| Capital Expenditure | ||||||||||
| UFCF | -4.2 | -23.1 | -32.9 | -39.8 | 15.9 | -42.2 | -61.8 | -89.5 | -129.4 | -187.2 |
| WACC, % | 9.86 | 9.86 | 9.74 | 9.86 | 9.86 | 9.83 | 9.83 | 9.83 | 9.83 | 9.83 |
| PV UFCF | ||||||||||
| SUM PV UFCF | -363.3 | |||||||||
| Long Term Growth Rate, % | 4.00 | |||||||||
| Free cash flow (T + 1) | -195 | |||||||||
| Terminal Value | -3,338 | |||||||||
| Present Terminal Value | -2,089 | |||||||||
| Enterprise Value | -2,452 | |||||||||
| Net Debt | 123 | |||||||||
| Equity Value | -2,575 | |||||||||
| Diluted Shares Outstanding, MM | 12 | |||||||||
| Equity Value Per Share | -216.07 |
What You Will Get
- Pre-Filled Financial Model: Kura Sushi USA's actual data allows for accurate DCF valuation.
- Full Forecast Control: Modify revenue growth, margins, WACC, and other essential drivers.
- Instant Calculations: Automatic updates provide immediate results as you adjust inputs.
- Investor-Ready Template: A polished Excel file crafted for professional-level valuation.
- Customizable and Reusable: Designed for adaptability, enabling repeated use for comprehensive forecasts.
Key Features
- Customizable Forecast Inputs: Adjust essential metrics such as revenue growth, EBITDA %, and capital expenditures.
- Instant DCF Valuation: Quickly computes intrinsic value, NPV, and other financial outputs.
- High-Precision Estimates: Leverages Kura Sushi's actual financial data for accurate valuation results.
- Effortless Scenario Analysis: Easily explore various assumptions and their impacts on outcomes.
- Efficiency Booster: Streamlines the valuation process, removing the need for intricate model creation.
How It Works
- Download: Obtain the comprehensive Excel file featuring Kura Sushi USA, Inc.'s (KRUS) financial data.
- Customize: Modify predictions such as sales growth, EBITDA %, and WACC to fit your analysis.
- Update Automatically: Watch as intrinsic value and NPV calculations refresh in real-time.
- Test Scenarios: Develop various projections and instantly evaluate different outcomes.
- Make Decisions: Leverage the valuation insights to inform your investment choices.
Why Choose Kura Sushi USA, Inc. (KRUS)?
- Delicious Experience: Enjoy a unique dining experience with our innovative sushi offerings.
- High-Quality Ingredients: We prioritize fresh and premium ingredients to ensure exceptional taste.
- Interactive Dining: Engage with our revolving sushi bar for a fun and interactive meal.
- Commitment to Sustainability: We focus on sustainable practices to protect our oceans and environment.
- Beloved by Customers: Join the community of sushi lovers who trust and enjoy our brand.
Who Should Use This Product?
- Investors: Accurately estimate Kura Sushi USA, Inc.'s (KRUS) fair value before making investment decisions.
- CFOs: Utilize a professional-grade DCF model for financial reporting and analysis specific to Kura Sushi USA, Inc. (KRUS).
- Consultants: Quickly adapt the template for valuation reports tailored to Kura Sushi USA, Inc. (KRUS) clients.
- Entrepreneurs: Gain insights into financial modeling practices used by leading restaurant companies like Kura Sushi USA, Inc. (KRUS).
- Educators: Use it as a teaching tool to demonstrate valuation methodologies relevant to Kura Sushi USA, Inc. (KRUS).
What the Template Contains
- Pre-Filled Data: Contains Kura Sushi USA, Inc.'s (KRUS) historical financials and projections.
- Discounted Cash Flow Model: Editable DCF valuation model featuring automatic calculations.
- Weighted Average Cost of Capital (WACC): A dedicated sheet for WACC calculations based on user-defined inputs.
- Key Financial Ratios: Evaluate Kura Sushi USA, Inc.'s (KRUS) profitability, efficiency, and leverage metrics.
- Customizable Inputs: Easily modify revenue growth, profit margins, and tax rates.
- Clear Dashboard: Visual representations and tables summarizing essential valuation outcomes.
Disclaimer
All information, articles, and product details provided on this website are for general informational and educational purposes only. We do not claim any ownership over, nor do we intend to infringe upon, any trademarks, copyrights, logos, brand names, or other intellectual property mentioned or depicted on this site. Such intellectual property remains the property of its respective owners, and any references here are made solely for identification or informational purposes, without implying any affiliation, endorsement, or partnership.
We make no representations or warranties, express or implied, regarding the accuracy, completeness, or suitability of any content or products presented. Nothing on this website should be construed as legal, tax, investment, financial, medical, or other professional advice. In addition, no part of this site—including articles or product references—constitutes a solicitation, recommendation, endorsement, advertisement, or offer to buy or sell any securities, franchises, or other financial instruments, particularly in jurisdictions where such activity would be unlawful.
All content is of a general nature and may not address the specific circumstances of any individual or entity. It is not a substitute for professional advice or services. Any actions you take based on the information provided here are strictly at your own risk. You accept full responsibility for any decisions or outcomes arising from your use of this website and agree to release us from any liability in connection with your use of, or reliance upon, the content or products found herein.