
|
Valoración de DCF Kerry Group Plc (KRZ.IR) |
Completamente Editable: Adáptelo A Sus Necesidades En Excel O Sheets
Diseño Profesional: Plantillas Confiables Y Estándares De La Industria
Predeterminadas Para Un Uso Rápido Y Eficiente
Compatible con MAC / PC, completamente desbloqueado
No Se Necesita Experiencia; Fáciles De Seguir
Kerry Group plc (KRZ.IR) Bundle
¡Agilice su análisis y mejore la precisión con nuestra calculadora DCF (Krzir)! Utilizando datos reales de Kerry Group PLC y supuestos personalizables, esta herramienta le permite pronosticar, analizar y evaluar (Krzir) como un inversor experimentado.
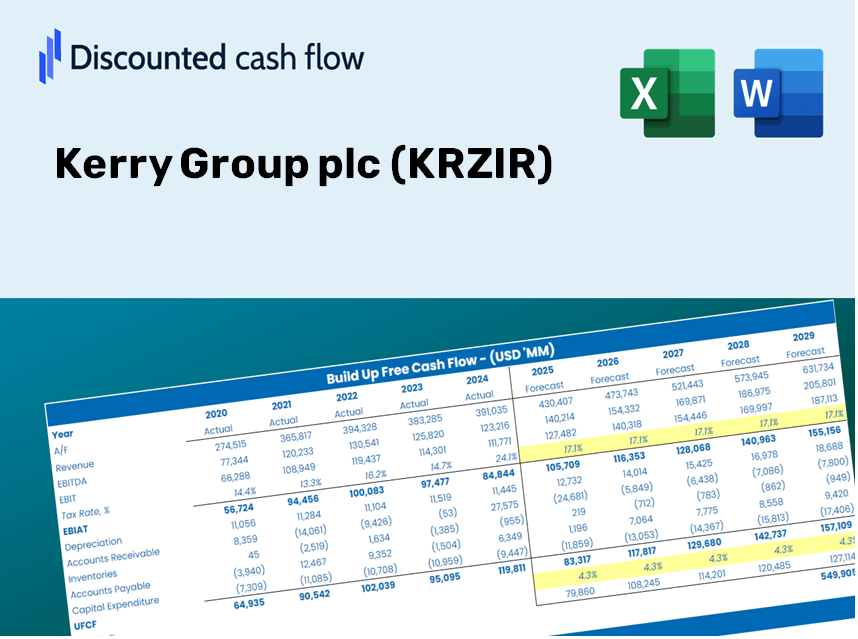
Discounted Cash Flow (DCF) - (USD MM)
| Year | AY1 2020 |
AY2 2021 |
AY3 2022 |
AY4 2023 |
AY5 2024 |
FY1 2025 |
FY2 2026 |
FY3 2027 |
FY4 2028 |
FY5 2029 |
|---|---|---|---|---|---|---|---|---|---|---|
| Revenue | 6,953.4 | 7,350.6 | 8,771.9 | 8,020.3 | 6,929.1 | 6,978.9 | 7,029.0 | 7,079.6 | 7,130.4 | 7,181.7 |
| Revenue Growth, % | 0 | 5.71 | 19.34 | -8.57 | -13.61 | 0.7186 | 0.7186 | 0.7186 | 0.7186 | 0.7186 |
| EBITDA | 981.9 | 1,167.7 | 1,056.8 | 1,164.6 | 1,190.7 | 1,029.5 | 1,036.9 | 1,044.4 | 1,051.9 | 1,059.4 |
| EBITDA, % | 14.12 | 15.89 | 12.05 | 14.52 | 17.18 | 14.75 | 14.75 | 14.75 | 14.75 | 14.75 |
| Depreciation | 273.3 | 284.2 | 306.3 | 301.0 | 322.6 | 274.9 | 276.9 | 278.9 | 280.9 | 282.9 |
| Depreciation, % | 3.93 | 3.87 | 3.49 | 3.75 | 4.66 | 3.94 | 3.94 | 3.94 | 3.94 | 3.94 |
| EBIT | 708.6 | 883.5 | 750.5 | 863.6 | 868.1 | 754.6 | 760.0 | 765.5 | 771.0 | 776.5 |
| EBIT, % | 10.19 | 12.02 | 8.56 | 10.77 | 12.53 | 10.81 | 10.81 | 10.81 | 10.81 | 10.81 |
| Total Cash | 577.2 | 1,054.3 | 1,029.5 | 943.7 | 1,610.0 | 968.4 | 975.4 | 982.4 | 989.4 | 996.6 |
| Total Cash, percent | .0 | .0 | .0 | .0 | .0 | .0 | .0 | .0 | .0 | .0 |
| Account Receivables | 956.1 | 1,175.9 | 1,419.0 | .0 | 1,188.5 | 880.4 | 886.7 | 893.1 | 899.5 | 906.0 |
| Account Receivables, % | 13.75 | 16 | 16.18 | 0 | 17.15 | 12.62 | 12.62 | 12.62 | 12.62 | 12.62 |
| Inventories | 975.6 | 1,204.2 | 1,354.4 | 1,100.2 | 1,050.7 | 1,043.1 | 1,050.6 | 1,058.2 | 1,065.8 | 1,073.4 |
| Inventories, % | 14.03 | 16.38 | 15.44 | 13.72 | 15.16 | 14.95 | 14.95 | 14.95 | 14.95 | 14.95 |
| Accounts Payable | 1,293.9 | 1,577.9 | 1,705.7 | 1,535.4 | 1,443.7 | 1,388.8 | 1,398.8 | 1,408.8 | 1,418.9 | 1,429.1 |
| Accounts Payable, % | 18.61 | 21.47 | 19.45 | 19.14 | 20.84 | 19.9 | 19.9 | 19.9 | 19.9 | 19.9 |
| Capital Expenditure | -280.0 | -298.0 | -221.0 | -281.9 | -305.8 | -258.6 | -260.5 | -262.3 | -264.2 | -266.1 |
| Capital Expenditure, % | -4.03 | -4.05 | -2.52 | -3.51 | -4.41 | -3.71 | -3.71 | -3.71 | -3.71 | -3.71 |
| Tax Rate, % | 5.65 | 5.65 | 5.65 | 5.65 | 5.65 | 5.65 | 5.65 | 5.65 | 5.65 | 5.65 |
| EBITAT | 618.0 | 825.8 | 651.2 | 764.6 | 819.0 | 679.6 | 684.5 | 689.4 | 694.4 | 699.4 |
| Depreciation | ||||||||||
| Changes in Account Receivables | ||||||||||
| Changes in Inventories | ||||||||||
| Changes in Accounts Payable | ||||||||||
| Capital Expenditure | ||||||||||
| UFCF | -26.5 | 647.6 | 471.0 | 2,286.6 | -394.9 | 956.7 | 697.1 | 702.1 | 707.2 | 712.2 |
| WACC, % | 5.91 | 5.96 | 5.91 | 5.92 | 5.97 | 5.94 | 5.94 | 5.94 | 5.94 | 5.94 |
| PV UFCF | ||||||||||
| SUM PV UFCF | 3,210.3 | |||||||||
| Long Term Growth Rate, % | 2.00 | |||||||||
| Free cash flow (T + 1) | 726 | |||||||||
| Terminal Value | 18,461 | |||||||||
| Present Terminal Value | 13,837 | |||||||||
| Enterprise Value | 17,047 | |||||||||
| Net Debt | 1,910 | |||||||||
| Equity Value | 15,138 | |||||||||
| Diluted Shares Outstanding, MM | 173 | |||||||||
| Equity Value Per Share | 87.35 |
What You Will Receive
- Pre-Filled Financial Model: Kerry Group's actual data provides an accurate DCF valuation.
- Complete Forecast Control: Modify revenue growth, profit margins, WACC, and other essential drivers.
- Immediate Calculations: Automatic updates display results in real-time as you make adjustments.
- Investor-Ready Template: A polished Excel file crafted for professional-standard valuation.
- Customizable and Reusable: Designed for adaptability, allowing repeated utilization for comprehensive forecasts.
Key Features
- 🔍 Real-Life KRZIR Financials: Pre-filled historical and projected data for Kerry Group plc.
- ✏️ Fully Customizable Inputs: Adjust all critical parameters (yellow cells) such as WACC, growth %, and tax rates.
- 📊 Professional DCF Valuation: Integrated formulas to calculate Kerry Group’s intrinsic value using the Discounted Cash Flow method.
- ⚡ Instant Results: Visualize the valuation of Kerry Group instantly after making adjustments.
- Scenario Analysis: Evaluate and compare outcomes based on various financial assumptions side-by-side.
How It Works
- Download the Template: Gain immediate access to the Excel-based KRZIR DCF Calculator.
- Input Your Assumptions: Modify the yellow-highlighted cells for growth rates, WACC, profit margins, and other key factors.
- Instant Calculations: The model will automatically refresh to display Kerry Group's intrinsic value.
- Test Scenarios: Experiment with various assumptions to assess potential changes in valuation.
- Analyze and Decide: Leverage the outcomes to inform your investment or financial analysis.
Why Opt for This Calculator?
- Precision: Leverages accurate Kerry Group plc (KRZIR) financial data.
- Versatility: Tailored for users to explore and adjust inputs effortlessly.
- Efficiency: Avoid the complexities of constructing a DCF model from the ground up.
- High-Quality Standards: Crafted with the expertise and usability standards expected at the CFO level.
- Intuitive Interface: Simple to navigate, even for those without extensive financial modeling skills.
Who Can Benefit from Kerry Group plc (KRZIR)?
- Individual Investors: Make well-informed choices when buying or selling shares of Kerry Group plc (KRZIR).
- Financial Analysts: Enhance valuation processes with accessible financial models tailored for Kerry Group plc (KRZIR).
- Consultants: Provide clients with precise and timely valuation insights related to Kerry Group plc (KRZIR).
- Business Owners: Gain insights into the valuation of major companies like Kerry Group plc (KRZIR) to refine your own strategies.
- Finance Students: Master valuation techniques by working with real-world data and scenarios from Kerry Group plc (KRZIR).
Components of the Template
- Pre-Filled Data: Contains Kerry Group plc's (KRZIR) historical financial data and projections.
- Discounted Cash Flow Model: A customizable DCF valuation model featuring automatic calculations.
- Weighted Average Cost of Capital (WACC): A specialized sheet for WACC calculations based on user-defined inputs.
- Key Financial Ratios: Assess Kerry Group plc's (KRZIR) profitability, efficiency, and financial leverage.
- Customizable Inputs: Easily modify revenue growth, profit margins, and tax rates.
- Clear Dashboard: Visual representations and tables highlighting essential valuation outcomes.
Disclaimer
All information, articles, and product details provided on this website are for general informational and educational purposes only. We do not claim any ownership over, nor do we intend to infringe upon, any trademarks, copyrights, logos, brand names, or other intellectual property mentioned or depicted on this site. Such intellectual property remains the property of its respective owners, and any references here are made solely for identification or informational purposes, without implying any affiliation, endorsement, or partnership.
We make no representations or warranties, express or implied, regarding the accuracy, completeness, or suitability of any content or products presented. Nothing on this website should be construed as legal, tax, investment, financial, medical, or other professional advice. In addition, no part of this site—including articles or product references—constitutes a solicitation, recommendation, endorsement, advertisement, or offer to buy or sell any securities, franchises, or other financial instruments, particularly in jurisdictions where such activity would be unlawful.
All content is of a general nature and may not address the specific circumstances of any individual or entity. It is not a substitute for professional advice or services. Any actions you take based on the information provided here are strictly at your own risk. You accept full responsibility for any decisions or outcomes arising from your use of this website and agree to release us from any liability in connection with your use of, or reliance upon, the content or products found herein.