
|
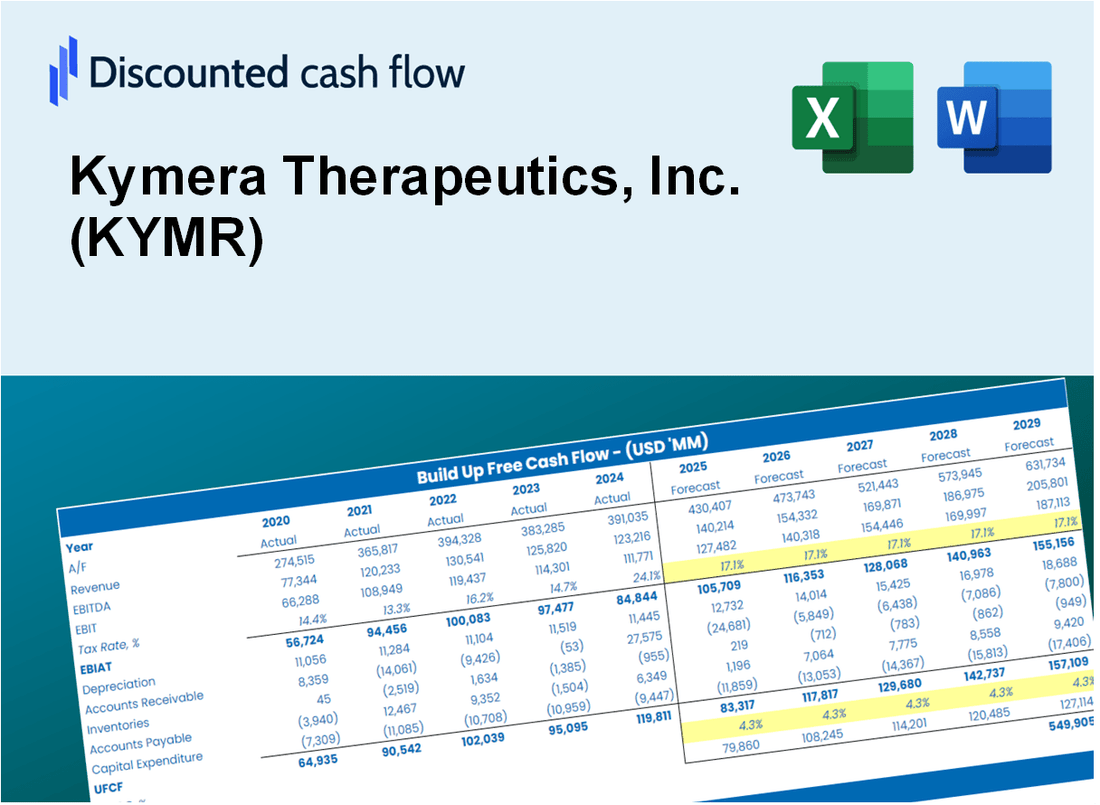
Valoración DCF de Kymera Therapeutics, Inc. (KYMR) |
Completamente Editable: Adáptelo A Sus Necesidades En Excel O Sheets
Diseño Profesional: Plantillas Confiables Y Estándares De La Industria
Predeterminadas Para Un Uso Rápido Y Eficiente
Compatible con MAC / PC, completamente desbloqueado
No Se Necesita Experiencia; Fáciles De Seguir
Kymera Therapeutics, Inc. (KYMR) Bundle
¿Busca calcular el valor intrínseco de Kymera Therapeutics, Inc.? Nuestra calculadora DCF (KYMR) integra datos del mundo real con extensas funciones de personalización, lo que le permite refinar sus pronósticos y mejorar sus opciones de inversión.
What You Will Get
- Real Kymera Data: Preloaded financials – from revenue to EBIT – based on actual and projected figures.
- Full Customization: Adjust all critical parameters (yellow cells) like WACC, growth %, and tax rates.
- Instant Valuation Updates: Automatic recalculations to analyze the impact of changes on Kymera Therapeutics’ fair value.
- Versatile Excel Template: Tailored for quick edits, scenario testing, and detailed projections.
- Time-Saving and Accurate: Skip building models from scratch while maintaining precision and flexibility.
Key Features
- Comprehensive Financial Data: Gain access to precise historical performance and future forecasts for Kymera Therapeutics, Inc. (KYMR).
- Adjustable Forecast Parameters: Modify highlighted fields such as WACC, growth rates, and profit margins.
- Real-Time Calculations: Automatic recalculations for DCF, Net Present Value (NPV), and cash flow metrics.
- Interactive Dashboard: User-friendly graphs and summaries to effectively present your valuation outcomes.
- Designed for All Skill Levels: An intuitive layout tailored for investors, CFOs, and consultants alike.
How It Works
- Step 1: Download the Excel file.
- Step 2: Review pre-entered Kymera Therapeutics data (historical and projected).
- Step 3: Adjust key assumptions (yellow cells) based on your analysis.
- Step 4: View automatic recalculations for Kymera Therapeutics’ intrinsic value.
- Step 5: Use the outputs for investment decisions or reporting.
Why Choose Kymera Therapeutics, Inc. (KYMR)?
- Innovative Solutions: Cutting-edge therapies designed to address unmet medical needs.
- Proven Expertise: A team of industry veterans dedicated to advancing drug development.
- Robust Pipeline: A diverse range of programs targeting serious diseases.
- Commitment to Quality: Adherence to the highest standards in research and manufacturing.
- Collaborative Approach: Partnerships with leading organizations to enhance therapeutic impact.
Who Should Use This Product?
- Individual Investors: Make informed decisions about buying or selling Kymera Therapeutics stock (KYMR).
- Financial Analysts: Streamline valuation processes with ready-to-use financial models for Kymera Therapeutics (KYMR).
- Consultants: Deliver professional valuation insights on Kymera Therapeutics (KYMR) to clients quickly and accurately.
- Business Owners: Understand how biotech companies like Kymera Therapeutics (KYMR) are valued to guide your own strategy.
- Finance Students: Learn valuation techniques using real-world data and scenarios related to Kymera Therapeutics (KYMR).
What the Template Contains
- Preloaded KYMR Data: Historical and projected financial data, including revenue, EBIT, and capital expenditures.
- DCF and WACC Models: Professional-grade sheets for calculating intrinsic value and Weighted Average Cost of Capital.
- Editable Inputs: Yellow-highlighted cells for adjusting revenue growth, tax rates, and discount rates.
- Financial Statements: Comprehensive annual and quarterly financials for deeper analysis.
- Key Ratios: Profitability, leverage, and efficiency ratios to evaluate performance.
- Dashboard and Charts: Visual summaries of valuation outcomes and assumptions.
Disclaimer
All information, articles, and product details provided on this website are for general informational and educational purposes only. We do not claim any ownership over, nor do we intend to infringe upon, any trademarks, copyrights, logos, brand names, or other intellectual property mentioned or depicted on this site. Such intellectual property remains the property of its respective owners, and any references here are made solely for identification or informational purposes, without implying any affiliation, endorsement, or partnership.
We make no representations or warranties, express or implied, regarding the accuracy, completeness, or suitability of any content or products presented. Nothing on this website should be construed as legal, tax, investment, financial, medical, or other professional advice. In addition, no part of this site—including articles or product references—constitutes a solicitation, recommendation, endorsement, advertisement, or offer to buy or sell any securities, franchises, or other financial instruments, particularly in jurisdictions where such activity would be unlawful.
All content is of a general nature and may not address the specific circumstances of any individual or entity. It is not a substitute for professional advice or services. Any actions you take based on the information provided here are strictly at your own risk. You accept full responsibility for any decisions or outcomes arising from your use of this website and agree to release us from any liability in connection with your use of, or reliance upon, the content or products found herein.