
|
nLIGHT, Inc. (LASR) Valoración DCF |
Completamente Editable: Adáptelo A Sus Necesidades En Excel O Sheets
Diseño Profesional: Plantillas Confiables Y Estándares De La Industria
Predeterminadas Para Un Uso Rápido Y Eficiente
Compatible con MAC / PC, completamente desbloqueado
No Se Necesita Experiencia; Fáciles De Seguir
nLIGHT, Inc. (LASR) Bundle
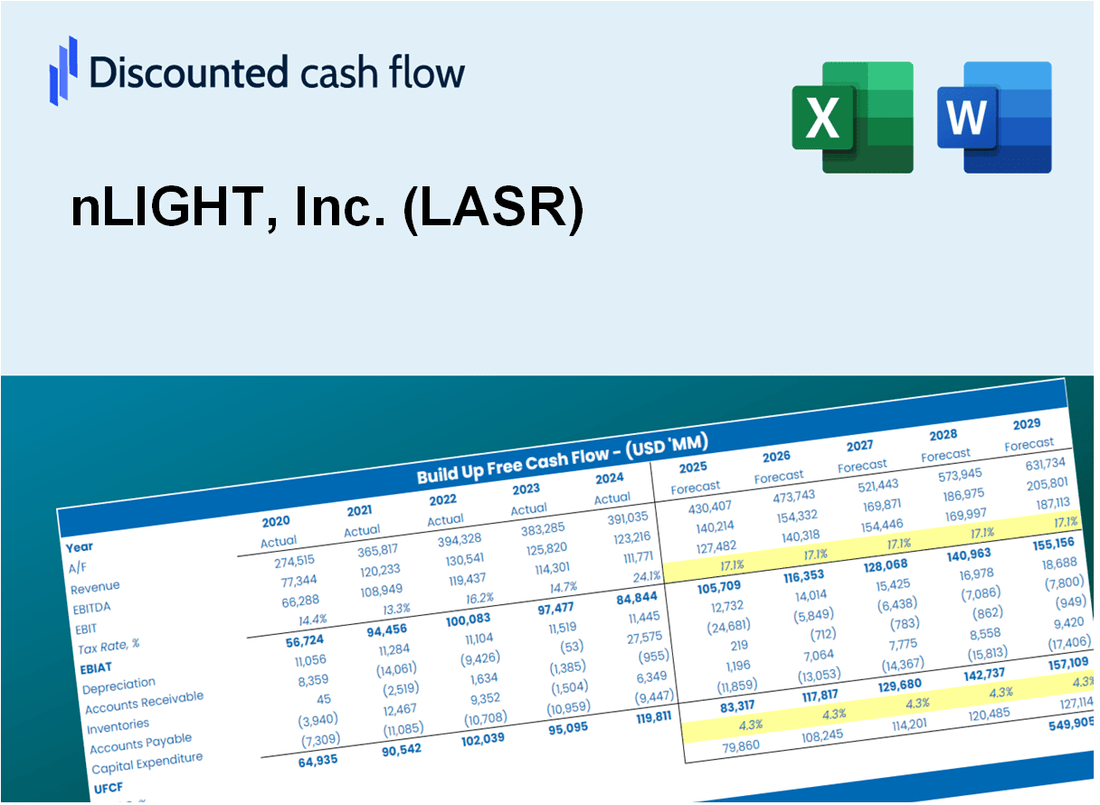
¡Explore Nlight, Inc. (LASR) Outlook financiero con nuestra calculadora DCF fácil de usar! Ingrese sus proyecciones para el crecimiento, los márgenes y los gastos para calcular el valor intrínseco de Nlight, Inc. (LASR) y mejorar su enfoque de inversión.
Discounted Cash Flow (DCF) - (USD MM)
| Year | AY1 2020 |
AY2 2021 |
AY3 2022 |
AY4 2023 |
AY5 2024 |
FY1 2025 |
FY2 2026 |
FY3 2027 |
FY4 2028 |
FY5 2029 |
|---|---|---|---|---|---|---|---|---|---|---|
| Revenue | 222.8 | 270.1 | 242.1 | 209.9 | 198.5 | 194.7 | 190.8 | 187.1 | 183.4 | 179.8 |
| Revenue Growth, % | 0 | 21.26 | -10.4 | -13.28 | -5.42 | -1.96 | -1.96 | -1.96 | -1.96 | -1.96 |
| EBITDA | -7.4 | -15.2 | -35.5 | -29.9 | -43.7 | -23.3 | -22.9 | -22.4 | -22.0 | -21.5 |
| EBITDA, % | -3.3 | -5.61 | -14.68 | -14.25 | -22.03 | -11.98 | -11.98 | -11.98 | -11.98 | -11.98 |
| Depreciation | 13.7 | 15.1 | 15.7 | 16.0 | 17.6 | 13.5 | 13.2 | 13.0 | 12.7 | 12.5 |
| Depreciation, % | 6.14 | 5.57 | 6.49 | 7.64 | 8.86 | 6.94 | 6.94 | 6.94 | 6.94 | 6.94 |
| EBIT | -21.0 | -30.2 | -51.2 | -45.9 | -61.3 | -36.8 | -36.1 | -35.4 | -34.7 | -34.0 |
| EBIT, % | -9.45 | -11.19 | -21.17 | -21.89 | -30.9 | -18.92 | -18.92 | -18.92 | -18.92 | -18.92 |
| Total Cash | 102.3 | 146.5 | 108.2 | 112.9 | 100.7 | 97.1 | 95.2 | 93.3 | 91.5 | 89.7 |
| Total Cash, percent | .0 | .0 | .0 | .0 | .0 | .0 | .0 | .0 | .0 | .0 |
| Account Receivables | 37.5 | 51.2 | 37.9 | 46.9 | 34.9 | 35.6 | 34.9 | 34.2 | 33.5 | 32.9 |
| Account Receivables, % | 16.83 | 18.96 | 15.66 | 22.33 | 17.58 | 18.27 | 18.27 | 18.27 | 18.27 | 18.27 |
| Inventories | 54.7 | 73.7 | 67.6 | 52.2 | 40.8 | 48.7 | 47.8 | 46.8 | 45.9 | 45.0 |
| Inventories, % | 24.56 | 27.3 | 27.93 | 24.85 | 20.55 | 25.04 | 25.04 | 25.04 | 25.04 | 25.04 |
| Accounts Payable | 21.1 | 26.3 | 17.5 | 12.2 | 15.1 | 15.5 | 15.2 | 14.9 | 14.6 | 14.3 |
| Accounts Payable, % | 9.45 | 9.75 | 7.23 | 5.8 | 7.59 | 7.97 | 7.97 | 7.97 | 7.97 | 7.97 |
| Capital Expenditure | -24.3 | -21.6 | -21.7 | -5.3 | -7.9 | -13.4 | -13.1 | -12.9 | -12.6 | -12.4 |
| Capital Expenditure, % | -10.93 | -7.98 | -8.97 | -2.54 | -4 | -6.88 | -6.88 | -6.88 | -6.88 | -6.88 |
| Tax Rate, % | 0.12486 | 0.12486 | 0.12486 | 0.12486 | 0.12486 | 0.12486 | 0.12486 | 0.12486 | 0.12486 | 0.12486 |
| EBITAT | -21.4 | -29.8 | -51.6 | -44.9 | -61.3 | -36.6 | -35.8 | -35.1 | -34.4 | -33.8 |
| Depreciation | ||||||||||
| Changes in Account Receivables | ||||||||||
| Changes in Inventories | ||||||||||
| Changes in Accounts Payable | ||||||||||
| Capital Expenditure | ||||||||||
| UFCF | -103.2 | -63.8 | -47.0 | -33.1 | -25.3 | -44.6 | -34.4 | -33.7 | -33.0 | -32.4 |
| WACC, % | 15.18 | 15.18 | 15.18 | 15.18 | 15.18 | 15.18 | 15.18 | 15.18 | 15.18 | 15.18 |
| PV UFCF | ||||||||||
| SUM PV UFCF | -121.5 | |||||||||
| Long Term Growth Rate, % | 2.00 | |||||||||
| Free cash flow (T + 1) | -33 | |||||||||
| Terminal Value | -251 | |||||||||
| Present Terminal Value | -124 | |||||||||
| Enterprise Value | -245 | |||||||||
| Net Debt | -54 | |||||||||
| Equity Value | -191 | |||||||||
| Diluted Shares Outstanding, MM | 48 | |||||||||
| Equity Value Per Share | -4.00 |
What You Will Get
- Pre-Filled Financial Model: nLIGHT, Inc.’s (LASR) actual data facilitates accurate DCF valuation.
- Full Forecast Control: Modify revenue growth, profit margins, WACC, and other essential drivers.
- Instant Calculations: Real-time updates ensure you see results immediately as changes are made.
- Investor-Ready Template: A polished Excel file crafted for high-quality valuation presentations.
- Customizable and Reusable: Designed for versatility, enabling repeated use for comprehensive forecasts.
Key Features
- 🔍 Real-Life LASR Financials: Pre-filled historical and projected data for nLIGHT, Inc.
- ✏️ Fully Customizable Inputs: Adjust all critical parameters (yellow cells) like WACC, growth %, and tax rates.
- 📊 Professional DCF Valuation: Built-in formulas calculate nLIGHT’s intrinsic value using the Discounted Cash Flow method.
- ⚡ Instant Results: Visualize nLIGHT’s valuation instantly after making changes.
- Scenario Analysis: Test and compare outcomes for various financial assumptions side-by-side.
How It Works
- Step 1: Download the Excel file for nLIGHT, Inc. (LASR).
- Step 2: Review nLIGHT's pre-filled financial data and projections.
- Step 3: Adjust key inputs such as revenue growth, WACC, and tax rates (highlighted cells).
- Step 4: Observe the DCF model update in real-time as you modify assumptions.
- Step 5: Evaluate the results and utilize them for investment strategies.
Why Choose This Calculator for nLIGHT, Inc. (LASR)?
- Comprehensive Tool: Offers DCF, WACC, and financial ratio analyses all in one convenient package.
- Customizable Inputs: Modify the yellow-highlighted cells to explore different financial scenarios.
- Detailed Insights: Automatically computes nLIGHT’s intrinsic value and Net Present Value.
- Preloaded Data: Historical and projected data provide reliable starting points for analysis.
- Professional Quality: Perfect for financial analysts, investors, and business consultants focused on nLIGHT, Inc. (LASR).
Who Should Use This Product?
- Individual Investors: Make informed decisions about buying or selling nLIGHT, Inc. (LASR) stock.
- Financial Analysts: Streamline valuation processes with ready-to-use financial models for nLIGHT, Inc. (LASR).
- Consultants: Deliver professional valuation insights on nLIGHT, Inc. (LASR) to clients quickly and accurately.
- Business Owners: Understand how companies like nLIGHT, Inc. (LASR) are valued to guide your own strategy.
- Finance Students: Learn valuation techniques using real-world data and scenarios related to nLIGHT, Inc. (LASR).
What the Template Contains
- Preloaded LASR Data: Historical and projected financial data, including revenue, EBIT, and capital expenditures.
- DCF and WACC Models: Professional-grade sheets for calculating intrinsic value and Weighted Average Cost of Capital.
- Editable Inputs: Yellow-highlighted cells for adjusting revenue growth, tax rates, and discount rates.
- Financial Statements: Comprehensive annual and quarterly financials for deeper analysis.
- Key Ratios: Profitability, leverage, and efficiency ratios to evaluate performance.
- Dashboard and Charts: Visual summaries of valuation outcomes and assumptions.
Disclaimer
All information, articles, and product details provided on this website are for general informational and educational purposes only. We do not claim any ownership over, nor do we intend to infringe upon, any trademarks, copyrights, logos, brand names, or other intellectual property mentioned or depicted on this site. Such intellectual property remains the property of its respective owners, and any references here are made solely for identification or informational purposes, without implying any affiliation, endorsement, or partnership.
We make no representations or warranties, express or implied, regarding the accuracy, completeness, or suitability of any content or products presented. Nothing on this website should be construed as legal, tax, investment, financial, medical, or other professional advice. In addition, no part of this site—including articles or product references—constitutes a solicitation, recommendation, endorsement, advertisement, or offer to buy or sell any securities, franchises, or other financial instruments, particularly in jurisdictions where such activity would be unlawful.
All content is of a general nature and may not address the specific circumstances of any individual or entity. It is not a substitute for professional advice or services. Any actions you take based on the information provided here are strictly at your own risk. You accept full responsibility for any decisions or outcomes arising from your use of this website and agree to release us from any liability in connection with your use of, or reliance upon, the content or products found herein.