
|
Valoración DCF de Leidos Holdings, Inc. (LDOS) |
Completamente Editable: Adáptelo A Sus Necesidades En Excel O Sheets
Diseño Profesional: Plantillas Confiables Y Estándares De La Industria
Predeterminadas Para Un Uso Rápido Y Eficiente
Compatible con MAC / PC, completamente desbloqueado
No Se Necesita Experiencia; Fáciles De Seguir
Leidos Holdings, Inc. (LDOS) Bundle
¡Mejore sus estrategias de inversión con la calculadora DCF de Leidos Holdings, Inc. (LDoS)! Revise los auténticos finanzas de Leidos, ajuste las proyecciones y gastos de crecimiento, y observe instantáneamente cómo estas modificaciones afectan el valor intrínseco de los LDO.
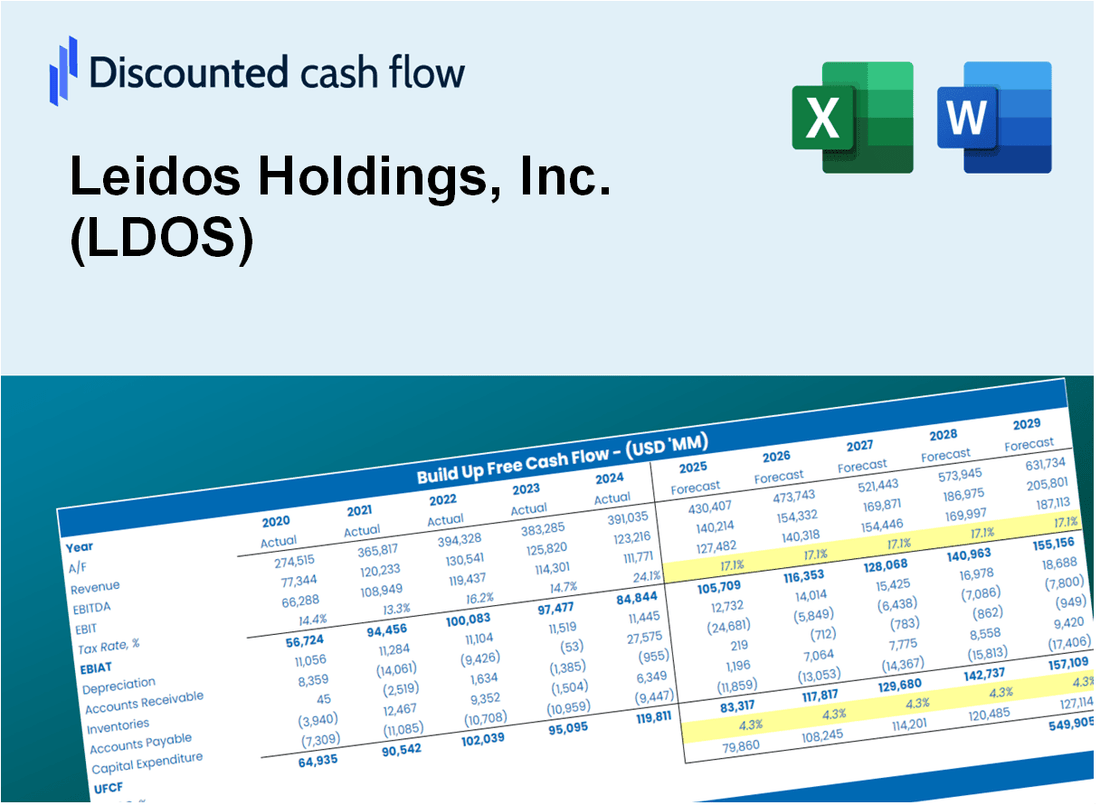
Discounted Cash Flow (DCF) - (USD MM)
| Year | AY1 2020 |
AY2 2021 |
AY3 2022 |
AY4 2023 |
AY5 2024 |
FY1 2025 |
FY2 2026 |
FY3 2027 |
FY4 2028 |
FY5 2029 |
|---|---|---|---|---|---|---|---|---|---|---|
| Revenue | 12,297.0 | 13,737.0 | 14,396.0 | 15,438.0 | 16,662.0 | 17,981.4 | 19,405.2 | 20,941.8 | 22,600.1 | 24,389.7 |
| Revenue Growth, % | 0 | 11.71 | 4.8 | 7.24 | 7.93 | 7.92 | 7.92 | 7.92 | 7.92 | 7.92 |
| EBITDA | 1,245.0 | 1,476.0 | 1,418.0 | 946.0 | 2,122.0 | 1,783.1 | 1,924.3 | 2,076.7 | 2,241.1 | 2,418.6 |
| EBITDA, % | 10.12 | 10.74 | 9.85 | 6.13 | 12.74 | 9.92 | 9.92 | 9.92 | 9.92 | 9.92 |
| Depreciation | 282.0 | 325.0 | 333.0 | 331.0 | 290.0 | 390.4 | 421.4 | 454.7 | 490.7 | 529.6 |
| Depreciation, % | 2.29 | 2.37 | 2.31 | 2.14 | 1.74 | 2.17 | 2.17 | 2.17 | 2.17 | 2.17 |
| EBIT | 963.0 | 1,151.0 | 1,085.0 | 615.0 | 1,832.0 | 1,392.7 | 1,503.0 | 1,622.0 | 1,750.4 | 1,889.0 |
| EBIT, % | 7.83 | 8.38 | 7.54 | 3.98 | 11 | 7.75 | 7.75 | 7.75 | 7.75 | 7.75 |
| Total Cash | 524.0 | 727.0 | 516.0 | 777.0 | 943.0 | 857.0 | 924.9 | 998.1 | 1,077.1 | 1,162.4 |
| Total Cash, percent | .0 | .0 | .0 | .0 | .0 | .0 | .0 | .0 | .0 | .0 |
| Account Receivables | 2,137.0 | 2,189.0 | 2,350.0 | 2,429.0 | 2,645.0 | 2,921.8 | 3,153.2 | 3,402.9 | 3,672.3 | 3,963.1 |
| Account Receivables, % | 17.38 | 15.94 | 16.32 | 15.73 | 15.87 | 16.25 | 16.25 | 16.25 | 16.25 | 16.25 |
| Inventories | 276.0 | 274.0 | 287.0 | 310.0 | 315.0 | 364.3 | 393.2 | 424.3 | 457.9 | 494.2 |
| Inventories, % | 2.24 | 1.99 | 1.99 | 2.01 | 1.89 | 2.03 | 2.03 | 2.03 | 2.03 | 2.03 |
| Accounts Payable | 731.0 | 692.0 | 733.0 | 736.0 | 705.0 | 901.7 | 973.1 | 1,050.1 | 1,133.3 | 1,223.0 |
| Accounts Payable, % | 5.94 | 5.04 | 5.09 | 4.77 | 4.23 | 5.01 | 5.01 | 5.01 | 5.01 | 5.01 |
| Capital Expenditure | -183.0 | -104.0 | -129.0 | -207.0 | -149.0 | -193.4 | -208.7 | -225.2 | -243.0 | -262.3 |
| Capital Expenditure, % | -1.49 | -0.75708 | -0.89608 | -1.34 | -0.89425 | -1.08 | -1.08 | -1.08 | -1.08 | -1.08 |
| Tax Rate, % | 23.49 | 23.49 | 23.49 | 23.49 | 23.49 | 23.49 | 23.49 | 23.49 | 23.49 | 23.49 |
| EBITAT | 774.3 | 896.3 | 838.9 | 303.7 | 1,401.7 | 1,006.9 | 1,086.6 | 1,172.6 | 1,265.5 | 1,365.7 |
| Depreciation | ||||||||||
| Changes in Account Receivables | ||||||||||
| Changes in Inventories | ||||||||||
| Changes in Accounts Payable | ||||||||||
| Capital Expenditure | ||||||||||
| UFCF | -808.7 | 1,028.3 | 909.9 | 328.7 | 1,290.7 | 1,074.5 | 1,110.5 | 1,198.4 | 1,293.3 | 1,395.7 |
| WACC, % | 6.41 | 6.39 | 6.39 | 6.21 | 6.38 | 6.36 | 6.36 | 6.36 | 6.36 | 6.36 |
| PV UFCF | ||||||||||
| SUM PV UFCF | 5,024.2 | |||||||||
| Long Term Growth Rate, % | 3.00 | |||||||||
| Free cash flow (T + 1) | 1,438 | |||||||||
| Terminal Value | 42,815 | |||||||||
| Present Terminal Value | 31,459 | |||||||||
| Enterprise Value | 36,484 | |||||||||
| Net Debt | 4,348 | |||||||||
| Equity Value | 32,136 | |||||||||
| Diluted Shares Outstanding, MM | 136 | |||||||||
| Equity Value Per Share | 236.29 |
What You Will Receive
- Pre-Filled Financial Model: Leidos Holdings, Inc.'s actual data facilitates accurate DCF valuation.
- Comprehensive Forecast Control: Modify revenue growth, profit margins, WACC, and other essential factors.
- Immediate Calculations: Automatic updates allow you to view results in real-time as you make adjustments.
- Investor-Ready Template: A polished Excel file crafted for high-quality valuation presentations.
- Customizable and Reusable: Designed for adaptability, enabling repeated application for in-depth forecasts.
Key Features
- 🔍 Real-Life LDOS Financials: Pre-filled historical and projected data for Leidos Holdings, Inc.
- ✏️ Fully Customizable Inputs: Adjust all critical parameters (yellow cells) like WACC, growth %, and tax rates.
- 📊 Professional DCF Valuation: Built-in formulas calculate Leidos’ intrinsic value using the Discounted Cash Flow method.
- ⚡ Instant Results: Visualize Leidos’ valuation instantly after making changes.
- Scenario Analysis: Test and compare outcomes for various financial assumptions side-by-side.
How It Works
- Download: Obtain the pre-configured Excel file containing Leidos Holdings, Inc.'s (LDOS) financial data.
- Customize: Modify projections, such as revenue growth, EBITDA %, and WACC.
- Update Automatically: The intrinsic value and NPV calculations refresh in real-time.
- Test Scenarios: Develop various projections and instantly compare results.
- Make Decisions: Leverage the valuation outcomes to inform your investment strategy.
Why Choose This Calculator for Leidos Holdings, Inc. (LDOS)?
- User-Friendly Interface: Crafted for both novices and seasoned professionals.
- Customizable Inputs: Adjust parameters effortlessly to suit your analysis needs.
- Real-Time Feedback: Observe immediate updates to Leidos’ valuation as you modify inputs.
- Preloaded Data: Comes equipped with Leidos’ actual financial information for swift evaluations.
- Widely Respected: Utilized by analysts and investors to guide strategic decisions.
Who Should Use This Product?
- Finance Students: Explore valuation methodologies and implement them with actual market data for Leidos Holdings, Inc. (LDOS).
- Academics: Integrate industry-standard models into your teaching or scholarly research focused on Leidos Holdings, Inc. (LDOS).
- Investors: Validate your investment hypotheses and evaluate valuation scenarios for Leidos Holdings, Inc. (LDOS).
- Analysts: Enhance your efficiency with a ready-to-use, adaptable DCF model tailored for Leidos Holdings, Inc. (LDOS).
- Small Business Owners: Understand the analytical approaches used to assess large corporations like Leidos Holdings, Inc. (LDOS).
What the Template Contains
- Pre-Filled DCF Model: Leidos Holdings, Inc.’s (LDOS) financial data preloaded for immediate use.
- WACC Calculator: Detailed calculations for Weighted Average Cost of Capital.
- Financial Ratios: Evaluate Leidos Holdings, Inc.’s (LDOS) profitability, leverage, and efficiency.
- Editable Inputs: Change assumptions such as growth, margins, and CAPEX to fit your scenarios.
- Financial Statements: Annual and quarterly reports to support detailed analysis.
- Interactive Dashboard: Easily visualize key valuation metrics and results.
Disclaimer
All information, articles, and product details provided on this website are for general informational and educational purposes only. We do not claim any ownership over, nor do we intend to infringe upon, any trademarks, copyrights, logos, brand names, or other intellectual property mentioned or depicted on this site. Such intellectual property remains the property of its respective owners, and any references here are made solely for identification or informational purposes, without implying any affiliation, endorsement, or partnership.
We make no representations or warranties, express or implied, regarding the accuracy, completeness, or suitability of any content or products presented. Nothing on this website should be construed as legal, tax, investment, financial, medical, or other professional advice. In addition, no part of this site—including articles or product references—constitutes a solicitation, recommendation, endorsement, advertisement, or offer to buy or sell any securities, franchises, or other financial instruments, particularly in jurisdictions where such activity would be unlawful.
All content is of a general nature and may not address the specific circumstances of any individual or entity. It is not a substitute for professional advice or services. Any actions you take based on the information provided here are strictly at your own risk. You accept full responsibility for any decisions or outcomes arising from your use of this website and agree to release us from any liability in connection with your use of, or reliance upon, the content or products found herein.