
|
Valoración DCF de LifeVantage Corporation (LFVN) |
Completamente Editable: Adáptelo A Sus Necesidades En Excel O Sheets
Diseño Profesional: Plantillas Confiables Y Estándares De La Industria
Predeterminadas Para Un Uso Rápido Y Eficiente
Compatible con MAC / PC, completamente desbloqueado
No Se Necesita Experiencia; Fáciles De Seguir
LifeVantage Corporation (LFVN) Bundle
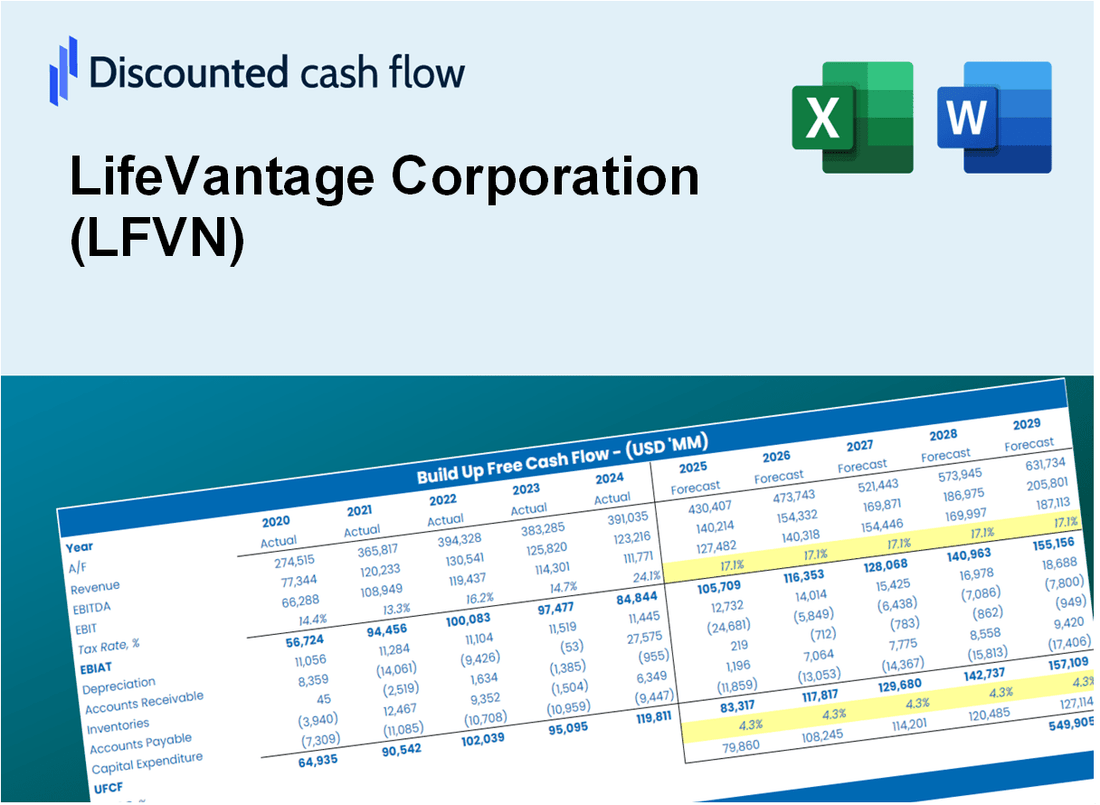
Como inversor o analista, la calculadora DCF de LifeVantage Corporation (LFVN) es su recurso de referencia para una valoración precisa. Equipado con datos reales de LifeVantage, puede ajustar los pronósticos y observar instantáneamente los efectos.
Discounted Cash Flow (DCF) - (USD MM)
| Year | AY1 2021 |
AY2 2022 |
AY3 2023 |
AY4 2024 |
AY5 2025 |
FY1 2026 |
FY2 2027 |
FY3 2028 |
FY4 2029 |
FY5 2030 |
|---|---|---|---|---|---|---|---|---|---|---|
| Revenue | 220.2 | 206.4 | 213.4 | 200.2 | 228.5 | 231.4 | 234.4 | 237.4 | 240.4 | 243.5 |
| Revenue Growth, % | 0 | -6.28 | 3.41 | -6.2 | 14.17 | 1.28 | 1.28 | 1.28 | 1.28 | 1.28 |
| EBITDA | 23.1 | 8.0 | 7.8 | 7.9 | 15.4 | 13.3 | 13.4 | 13.6 | 13.8 | 14.0 |
| EBITDA, % | 10.48 | 3.86 | 3.67 | 3.95 | 6.72 | 5.74 | 5.74 | 5.74 | 5.74 | 5.74 |
| Depreciation | 5.8 | 3.3 | 3.6 | 3.6 | 3.2 | 4.2 | 4.3 | 4.3 | 4.4 | 4.4 |
| Depreciation, % | 2.65 | 1.58 | 1.68 | 1.79 | 1.38 | 1.81 | 1.81 | 1.81 | 1.81 | 1.81 |
| EBIT | 17.2 | 4.7 | 4.3 | 4.3 | 12.2 | 9.1 | 9.2 | 9.3 | 9.4 | 9.5 |
| EBIT, % | 7.83 | 2.28 | 2 | 2.16 | 5.34 | 3.92 | 3.92 | 3.92 | 3.92 | 3.92 |
| Total Cash | 23.2 | 20.2 | 21.6 | 16.9 | 20.2 | 22.1 | 22.4 | 22.7 | 22.9 | 23.2 |
| Total Cash, percent | .0 | .0 | .0 | .0 | .0 | .0 | .0 | .0 | .0 | .0 |
| Account Receivables | 4.0 | 5.1 | 1.9 | 3.3 | 3.9 | 3.9 | 4.0 | 4.0 | 4.1 | 4.1 |
| Account Receivables, % | 1.8 | 2.47 | 0.86833 | 1.63 | 1.72 | 1.7 | 1.7 | 1.7 | 1.7 | 1.7 |
| Inventories | 16.1 | 16.5 | 16.1 | 15.1 | 20.7 | 18.2 | 18.5 | 18.7 | 19.0 | 19.2 |
| Inventories, % | 7.33 | 7.98 | 7.53 | 7.52 | 9.04 | 7.88 | 7.88 | 7.88 | 7.88 | 7.88 |
| Accounts Payable | 7.6 | 7.9 | 4.2 | 6.3 | 5.1 | 6.8 | 6.9 | 6.9 | 7.0 | 7.1 |
| Accounts Payable, % | 3.45 | 3.84 | 1.98 | 3.14 | 2.21 | 2.92 | 2.92 | 2.92 | 2.92 | 2.92 |
| Capital Expenditure | -3.7 | -3.1 | -3.1 | -1.4 | -1.4 | -2.7 | -2.8 | -2.8 | -2.8 | -2.9 |
| Capital Expenditure, % | -1.7 | -1.49 | -1.44 | -0.68494 | -0.59992 | -1.18 | -1.18 | -1.18 | -1.18 | -1.18 |
| Tax Rate, % | 19.91 | 19.91 | 19.91 | 19.91 | 19.91 | 19.91 | 19.91 | 19.91 | 19.91 | 19.91 |
| EBITAT | 12.9 | 3.1 | 2.7 | 2.9 | 9.8 | 6.4 | 6.5 | 6.6 | 6.6 | 6.7 |
| Depreciation | ||||||||||
| Changes in Account Receivables | ||||||||||
| Changes in Inventories | ||||||||||
| Changes in Accounts Payable | ||||||||||
| Capital Expenditure | ||||||||||
| UFCF | 2.5 | 2.2 | 3.2 | 6.8 | 4.0 | 12.0 | 7.8 | 7.9 | 8.0 | 8.1 |
| WACC, % | 4.92 | 4.88 | 4.87 | 4.88 | 4.94 | 4.9 | 4.9 | 4.9 | 4.9 | 4.9 |
| PV UFCF | ||||||||||
| SUM PV UFCF | 38.3 | |||||||||
| Long Term Growth Rate, % | 2.00 | |||||||||
| Free cash flow (T + 1) | 8 | |||||||||
| Terminal Value | 284 | |||||||||
| Present Terminal Value | 224 | |||||||||
| Enterprise Value | 262 | |||||||||
| Net Debt | -9 | |||||||||
| Equity Value | 271 | |||||||||
| Diluted Shares Outstanding, MM | 13 | |||||||||
| Equity Value Per Share | 20.83 |
What You Will Get
- Real LFVN Financial Data: Pre-filled with LifeVantage’s historical and projected data for precise analysis.
- Fully Editable Template: Modify key inputs like revenue growth, WACC, and EBITDA % with ease.
- Automatic Calculations: See LifeVantage’s intrinsic value update instantly based on your changes.
- Professional Valuation Tool: Designed for investors, analysts, and consultants seeking accurate DCF results.
- User-Friendly Design: Simple structure and clear instructions for all experience levels.
Key Features
- Customizable Growth Metrics: Adjust essential inputs such as sales growth, profit margins, and operational expenses.
- Instant DCF Valuation: Quickly computes intrinsic value, NPV, and additional financial metrics.
- High-Precision Accuracy: Leverages LifeVantage's actual financial data for credible valuation results.
- Effortless Scenario Testing: Evaluate various assumptions and analyze outcomes with ease.
- Efficiency Booster: Remove the hassle of creating intricate valuation models from the ground up.
How It Works
- Download: Obtain the comprehensive Excel file featuring LifeVantage Corporation's (LFVN) financial data.
- Customize: Tailor forecasts, such as revenue growth, EBITDA %, and WACC to your preferences.
- Update Automatically: Watch as the intrinsic value and NPV calculations refresh in real-time.
- Test Scenarios: Develop various projections and analyze the results immediately.
- Make Decisions: Leverage the valuation outcomes to inform your investment approach.
Why Choose LifeVantage Corporation (LFVN)?
- Innovative Products: Cutting-edge solutions designed to enhance health and wellness.
- Proven Results: Backed by scientific research and customer testimonials that demonstrate effectiveness.
- Strong Community: Join a vibrant network of individuals dedicated to improving lives.
- Flexible Opportunities: Various business models to suit different lifestyles and goals.
- Commitment to Quality: Rigorous standards ensure that every product meets high-quality benchmarks.
Who Should Use This Product?
- Investors: Evaluate LifeVantage Corporation's (LFVN) financial health before making investment decisions.
- CFOs and Financial Analysts: Optimize valuation methodologies and assess future projections for LifeVantage Corporation.
- Startup Founders: Understand the valuation strategies applied to publicly traded companies like LifeVantage Corporation.
- Consultants: Create comprehensive valuation reports tailored for clients focusing on LifeVantage Corporation.
- Students and Educators: Utilize real-life data from LifeVantage Corporation to practice and teach valuation concepts.
What the Template Contains
- Pre-Filled Data: Includes LifeVantage Corporation's historical financials and forecasts.
- Discounted Cash Flow Model: Editable DCF valuation model with automatic calculations.
- Weighted Average Cost of Capital (WACC): A dedicated sheet for calculating WACC based on custom inputs.
- Key Financial Ratios: Analyze LifeVantage Corporation's profitability, efficiency, and leverage.
- Customizable Inputs: Edit revenue growth, margins, and tax rates with ease.
- Clear Dashboard: Charts and tables summarizing key valuation results.
Disclaimer
All information, articles, and product details provided on this website are for general informational and educational purposes only. We do not claim any ownership over, nor do we intend to infringe upon, any trademarks, copyrights, logos, brand names, or other intellectual property mentioned or depicted on this site. Such intellectual property remains the property of its respective owners, and any references here are made solely for identification or informational purposes, without implying any affiliation, endorsement, or partnership.
We make no representations or warranties, express or implied, regarding the accuracy, completeness, or suitability of any content or products presented. Nothing on this website should be construed as legal, tax, investment, financial, medical, or other professional advice. In addition, no part of this site—including articles or product references—constitutes a solicitation, recommendation, endorsement, advertisement, or offer to buy or sell any securities, franchises, or other financial instruments, particularly in jurisdictions where such activity would be unlawful.
All content is of a general nature and may not address the specific circumstances of any individual or entity. It is not a substitute for professional advice or services. Any actions you take based on the information provided here are strictly at your own risk. You accept full responsibility for any decisions or outcomes arising from your use of this website and agree to release us from any liability in connection with your use of, or reliance upon, the content or products found herein.