
|
Valoración DCF de Lindblad Expeditions Holdings, Inc. (LIND) |
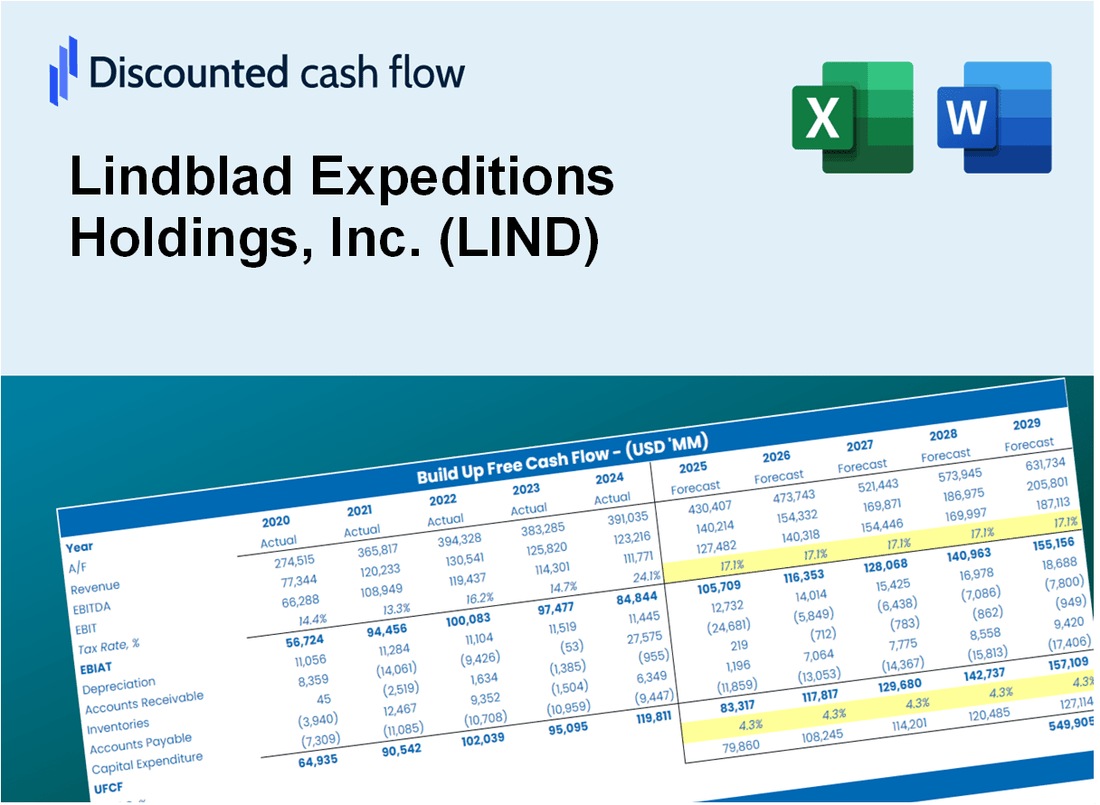
Completamente Editable: Adáptelo A Sus Necesidades En Excel O Sheets
Diseño Profesional: Plantillas Confiables Y Estándares De La Industria
Predeterminadas Para Un Uso Rápido Y Eficiente
Compatible con MAC / PC, completamente desbloqueado
No Se Necesita Experiencia; Fáciles De Seguir
Lindblad Expeditions Holdings, Inc. (LIND) Bundle
¿Busca evaluar el valor intrínseco de Lindblad Expeditions Holdings, Inc.? Nuestra calculadora DCF (Lind) integra datos del mundo real con extensas características de personalización, lo que le permite ajustar los pronósticos y mejorar sus estrategias de inversión.
Discounted Cash Flow (DCF) - (USD MM)
| Year | AY1 2020 |
AY2 2021 |
AY3 2022 |
AY4 2023 |
AY5 2024 |
FY1 2025 |
FY2 2026 |
FY3 2027 |
FY4 2028 |
FY5 2029 |
|---|---|---|---|---|---|---|---|---|---|---|
| Revenue | 82.4 | 147.1 | 421.5 | 569.5 | 644.7 | 1,010.5 | 1,583.9 | 2,482.5 | 3,891.0 | 6,098.6 |
| Revenue Growth, % | 0 | 78.62 | 186.53 | 35.12 | 13.2 | 56.74 | 56.74 | 56.74 | 56.74 | 56.74 |
| EBITDA | -61.2 | -57.1 | -19.9 | 54.8 | 74.1 | -195.4 | -306.3 | -480.1 | -752.4 | -1,179.3 |
| EBITDA, % | -74.27 | -38.8 | -4.73 | 9.62 | 11.5 | -19.34 | -19.34 | -19.34 | -19.34 | -19.34 |
| Depreciation | 32.1 | 39.5 | 44.7 | 47.5 | 53.5 | 188.1 | 294.8 | 462.0 | 724.2 | 1,135.0 |
| Depreciation, % | 38.96 | 26.87 | 10.59 | 8.34 | 8.3 | 18.61 | 18.61 | 18.61 | 18.61 | 18.61 |
| EBIT | -93.3 | -96.6 | -64.6 | 7.3 | 20.6 | -356.7 | -559.2 | -876.4 | -1,373.6 | -2,153.0 |
| EBIT, % | -113.23 | -65.67 | -15.32 | 1.28 | 3.2 | -35.3 | -35.3 | -35.3 | -35.3 | -35.3 |
| Total Cash | 187.5 | 150.8 | 100.8 | 156.8 | 183.9 | 565.8 | 886.9 | 1,390.1 | 2,178.8 | 3,414.9 |
| Total Cash, percent | .0 | .0 | .0 | .0 | .0 | .0 | .0 | .0 | .0 | .0 |
| Account Receivables | .0 | .0 | .0 | .0 | .0 | .0 | .0 | .0 | .0 | .0 |
| Account Receivables, % | 0 | 0 | 0 | 0 | 0 | 0 | 0 | 0 | 0 | 0 |
| Inventories | 7.6 | 10.6 | 11.9 | 5.4 | .0 | 40.9 | 64.1 | 100.5 | 157.5 | 246.8 |
| Inventories, % | 9.28 | 7.17 | 2.83 | 0.9548 | 0 | 4.05 | 4.05 | 4.05 | 4.05 | 4.05 |
| Accounts Payable | 5.3 | 9.7 | 16.6 | 16.2 | 13.9 | 44.3 | 69.5 | 108.9 | 170.7 | 267.5 |
| Accounts Payable, % | 6.42 | 6.59 | 3.94 | 2.84 | 2.15 | 4.39 | 4.39 | 4.39 | 4.39 | 4.39 |
| Capital Expenditure | -155.5 | -96.7 | -38.2 | -30.0 | -33.5 | -374.4 | -586.8 | -919.8 | -1,441.6 | -2,259.5 |
| Capital Expenditure, % | -188.79 | -65.73 | -9.06 | -5.26 | -5.2 | -37.05 | -37.05 | -37.05 | -37.05 | -37.05 |
| Tax Rate, % | -24.26 | -24.26 | -24.26 | -24.26 | -24.26 | -24.26 | -24.26 | -24.26 | -24.26 | -24.26 |
| EBITAT | -83.7 | -95.0 | -70.5 | 8.8 | 25.7 | -348.3 | -545.9 | -855.7 | -1,341.1 | -2,102.1 |
| Depreciation | ||||||||||
| Changes in Account Receivables | ||||||||||
| Changes in Inventories | ||||||||||
| Changes in Accounts Payable | ||||||||||
| Capital Expenditure | ||||||||||
| UFCF | -209.5 | -150.7 | -58.5 | 32.4 | 48.8 | -545.1 | -836.0 | -1,310.3 | -2,053.8 | -3,219.1 |
| WACC, % | 10.79 | 11.09 | 11.15 | 11.15 | 11.15 | 11.07 | 11.07 | 11.07 | 11.07 | 11.07 |
| PV UFCF | ||||||||||
| SUM PV UFCF | -5,379.1 | |||||||||
| Long Term Growth Rate, % | 2.00 | |||||||||
| Free cash flow (T + 1) | -3,283 | |||||||||
| Terminal Value | -36,212 | |||||||||
| Present Terminal Value | -21,425 | |||||||||
| Enterprise Value | -26,804 | |||||||||
| Net Debt | 443 | |||||||||
| Equity Value | -27,248 | |||||||||
| Diluted Shares Outstanding, MM | 54 | |||||||||
| Equity Value Per Share | -506.30 |
What You Will Get
- Editable Excel Template: A fully customizable Excel-based DCF Calculator featuring pre-filled real LIND financials.
- Real-World Data: Historical data and forward-looking estimates (as illustrated in the highlighted cells).
- Forecast Flexibility: Adjust forecast assumptions such as revenue growth, EBITDA %, and WACC.
- Automatic Calculations: Instantly observe the effect of your inputs on Lindblad Expeditions' valuation.
- Professional Tool: Designed for investors, CFOs, consultants, and financial analysts.
- User-Friendly Design: Organized for clarity and ease of use, complete with step-by-step instructions.
Key Features
- Authentic Financial Data: Gain access to reliable historical data and future forecasts tailored for Lindblad Expeditions Holdings, Inc. (LIND).
- Adjustable Forecast Parameters: Modify highlighted fields such as WACC, growth rates, and profit margins to suit your analysis.
- Real-Time Calculations: Automatic updates for DCF, Net Present Value (NPV), and cash flow assessments.
- User-Friendly Dashboard: Intuitive charts and summaries to help you visualize your valuation insights.
- Designed for All Skill Levels: An accessible layout suitable for investors, CFOs, and consultants alike.
How It Works
- 1. Access the Template: Download and open the Excel file featuring Lindblad Expeditions' preloaded data.
- 2. Adjust Assumptions: Modify key parameters such as growth rates, WACC, and capital expenditures.
- 3. View Results Instantly: The DCF model automatically calculates intrinsic value and NPV.
- 4. Explore Scenarios: Analyze various forecasts to evaluate different valuation results.
- 5. Present with Confidence: Share professional valuation insights to enhance your decision-making.
Why Choose This Calculator for Lindblad Expeditions Holdings, Inc. (LIND)?
- Comprehensive Tool: Integrates DCF, WACC, and financial ratio analyses tailored for the travel and expedition sector.
- Customizable Inputs: Modify yellow-highlighted cells to explore different financial scenarios for Lindblad Expeditions.
- Detailed Insights: Automatically computes the intrinsic value and Net Present Value specific to Lindblad Expeditions Holdings, Inc. (LIND).
- Preloaded Data: Features historical and forecasted data relevant to the expedition industry for precise calculations.
- Professional Quality: Perfect for financial analysts, investors, and consultants focused on the travel and tourism market.
Who Should Use Lindblad Expeditions Holdings, Inc. (LIND)?
- Travel Enthusiasts: Explore unique travel experiences with a focus on adventure and conservation.
- Environmental Advocates: Support sustainable tourism practices that protect the planet.
- Adventure Seekers: Discover thrilling expeditions to remote locations around the globe.
- Educators and Students: Learn about marine biology and ecology through immersive travel experiences.
- Investors: Gain insights into the growing market of eco-conscious travel and adventure tourism.
What the Template Contains
- Pre-Filled DCF Model: Lindblad Expeditions' financial data preloaded for immediate use.
- WACC Calculator: Detailed calculations for Weighted Average Cost of Capital.
- Financial Ratios: Evaluate Lindblad Expeditions' profitability, leverage, and efficiency.
- Editable Inputs: Change assumptions such as growth, margins, and CAPEX to fit your scenarios.
- Financial Statements: Annual and quarterly reports to support detailed analysis.
- Interactive Dashboard: Easily visualize key valuation metrics and results.
Disclaimer
All information, articles, and product details provided on this website are for general informational and educational purposes only. We do not claim any ownership over, nor do we intend to infringe upon, any trademarks, copyrights, logos, brand names, or other intellectual property mentioned or depicted on this site. Such intellectual property remains the property of its respective owners, and any references here are made solely for identification or informational purposes, without implying any affiliation, endorsement, or partnership.
We make no representations or warranties, express or implied, regarding the accuracy, completeness, or suitability of any content or products presented. Nothing on this website should be construed as legal, tax, investment, financial, medical, or other professional advice. In addition, no part of this site—including articles or product references—constitutes a solicitation, recommendation, endorsement, advertisement, or offer to buy or sell any securities, franchises, or other financial instruments, particularly in jurisdictions where such activity would be unlawful.
All content is of a general nature and may not address the specific circumstances of any individual or entity. It is not a substitute for professional advice or services. Any actions you take based on the information provided here are strictly at your own risk. You accept full responsibility for any decisions or outcomes arising from your use of this website and agree to release us from any liability in connection with your use of, or reliance upon, the content or products found herein.